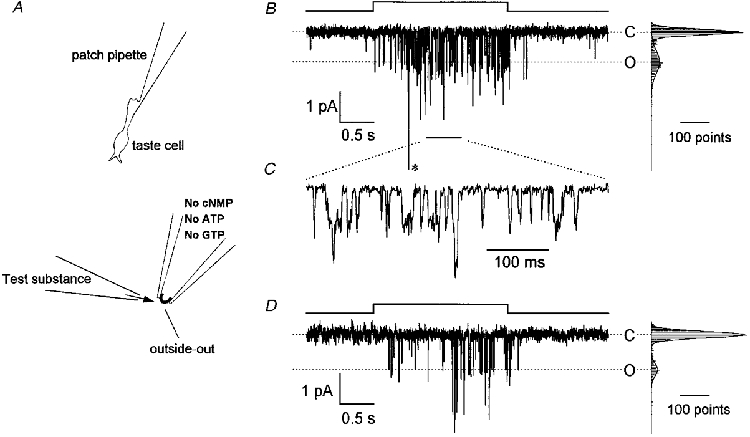
Figure 1. Currents induced by bitter substances in the outside-out membrane patches.

A, schematic diagram showing the experimental procedure. After the whole-cell configuration (upper panel) was established, a patch membrane was excised from an isolated taste receptor cell using a patch pipette filled with a solution containing no cNMP, Ca2+, ATP or GTP. A bitter substance was dissolved in the external solution and drawn into the puffer pipette, and applied to the outer surface of the patch membrane by pressure (lower panel). B, quinine-induced current response recorded from an outside-out membrane patch held at -79 mV. The upwards step in the pressure protocol (top) indicates the timing of 1 mM quinine application from the puffer pipette with a pressure of 20 kPa. The outside of the membrane was bathed in 120 mM NaCl (no Ca2+ added) solution and the patch pipette contained 120 mM CsCl. The amplitude histogram on the right side of the current trace was made from 2000 points during the 2 s quinine application. The histogram was fitted by the sum of two Gaussian distributions represented by continuous curves. The higher peak represents the closed state (C) and the lower peak represents the open state of one channel (O). The event labelled with an asterisk is quadruple the amplitude of the unitary current. C, part of the trace in B (indicated by a short bar below the current trace) reproduced on an expanded time scale. D, denatonium-induced current response in another outside-out patch. Denatonium (5 mM) was puff applied with a pressure of 50 kPa. The bath solution contained 115 mM NaCl and 2.5 mM KCl (no Ca2+ added). Other conditions were identical to those in B.
