
Figure 4. Dose dependence of the quinine-evoked current response.
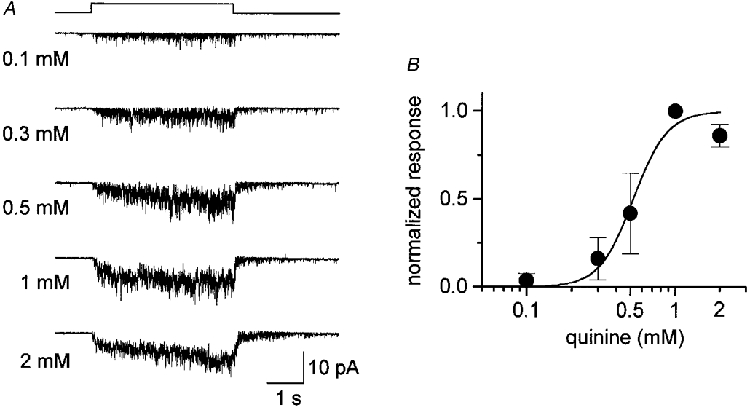
A, current responses induced by quinine at various concentrations. Test solution was applied using a U-shaped tube (see Methods) during the period indicated by the square step above the current traces. The patch membrane was held at -54 mV. The outside of the membrane was bathed in a solution containing 115 mM NaCl and 2.5 mM KCl (no Ca2+ added). B, relation between the response magnitude (total charge carried during 4 s quinine application) and the concentration of quinine. The response was normalized to that generated by 1 mM quinine. Filled circles represent the mean and bars the s.d. of three cells. The continuous curve was fitted by the Hill equation, I/Imax=cnH/(cnH+K½), with a Hill coefficient nH= 3.8 and K½= 0.52 mM, where c is the concentration of quinine.