
Figure 2. CSD propagation across the surface of the cat brain in vivo.
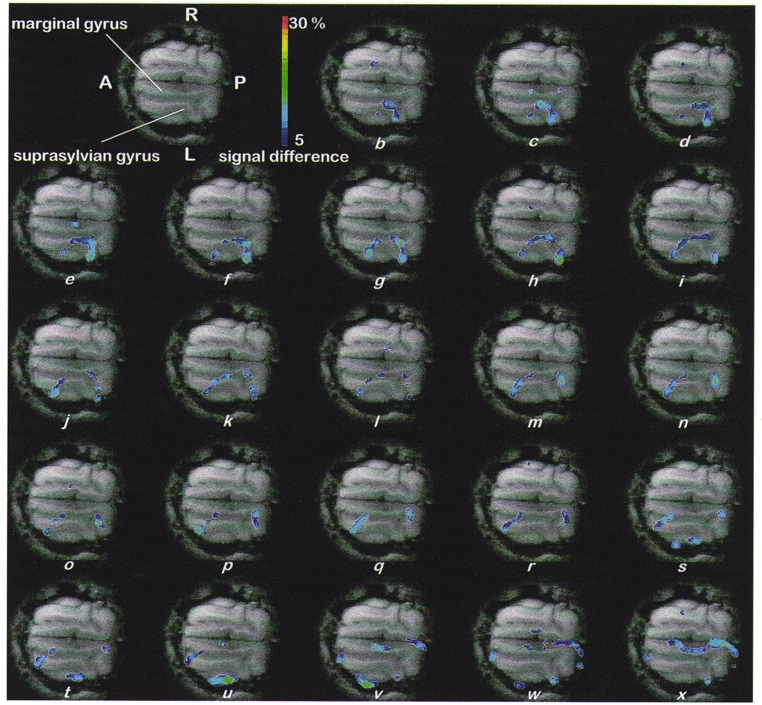
a (top, left), control, horizontal, gradient-echo anatomical image depicting the suprasylvian and marginal gyri. Remaining images (b-x): coloured overlays, shown at 10 s intervals starting about 50 s after KCl application, represent elliptical regions of reduced diffusion travelling away from the KCl application site with velocity 3.2 ± 0.1 mm min−1 (mean ±s.e.m. of 5 measurements). Over the first 11 frames (b-l) the wave travels both rostrally and caudally along the suprasylvian gyrus; when it reaches the caudal junction of the two gyri (frames 12-18; m-s) it appears to pass into the marginal gyrus (frames 19-23; t-x); likewise, rostrally, the wave passes first (frames 17-23; r-x) into the ectosylvian gyrus where it dissipates (frames 21-23; v-x) and then into the marginal gyrus (frames 19-23; t-x). Waves were never detected in the contralateral hemisphere. Abbreviations: A, anterior; P, posterior; R, right; L, left; overlays were obtained by subtracting a baseline image from the high-b images obtained in the DWEP sequence and transforming the signal difference into a percentage change (blue 5 %, red 30 %). Scale bar, 15 mm.