
Figure 4. Changes in the ADC with time during a control period before KCl application.
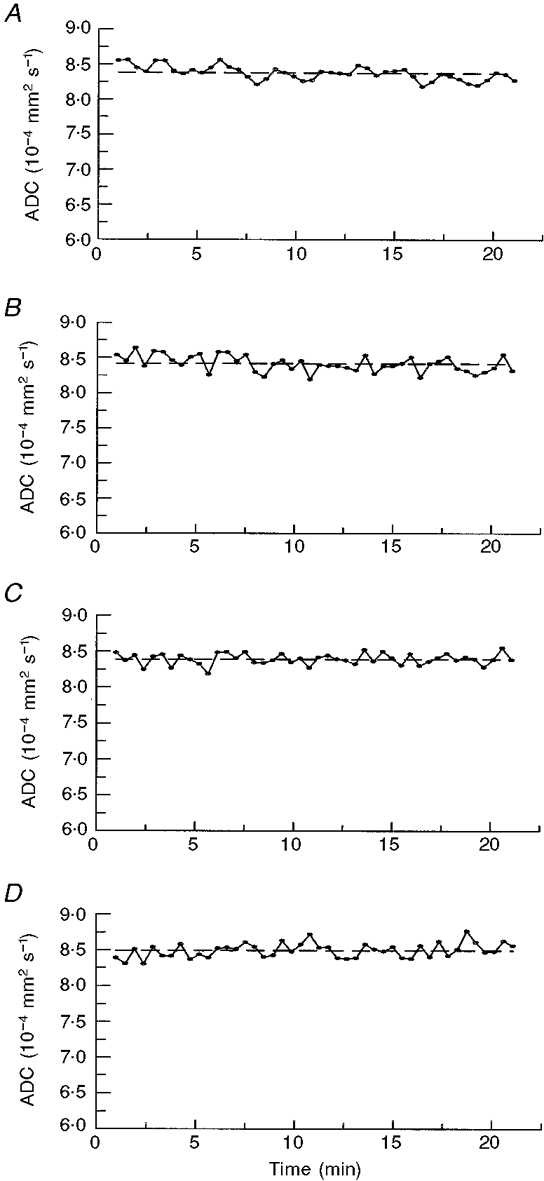
A-D, average ADC values over time were calculated for an ≈20 min pre-KCl application control period using the ROIs identified in Fig. 3. The average ADC value for the control period is indicated by the horizontal dashed line. Mean ADC values (±s.d.) for the 4 ROIs (Fig. 3A-D) are 8.38 × 10⁻⁴± 1.23 × 10⁻⁵, 8.42 × 10⁻⁴± 1.13 × 10⁻⁵, 8.39 × 10⁻⁴± 7.86 × 10⁻⁶ and 8.49 × 10⁻⁴± 1.22 × 10⁻⁵ mm2 s−1, respectively; the s.d. accounts, respectively, for 1.5, 1.3, 0.9 and 1.4 % of the ADC values in the unstimulated brain.