
Figure 5. Changes in the ADC with time after KCl application.
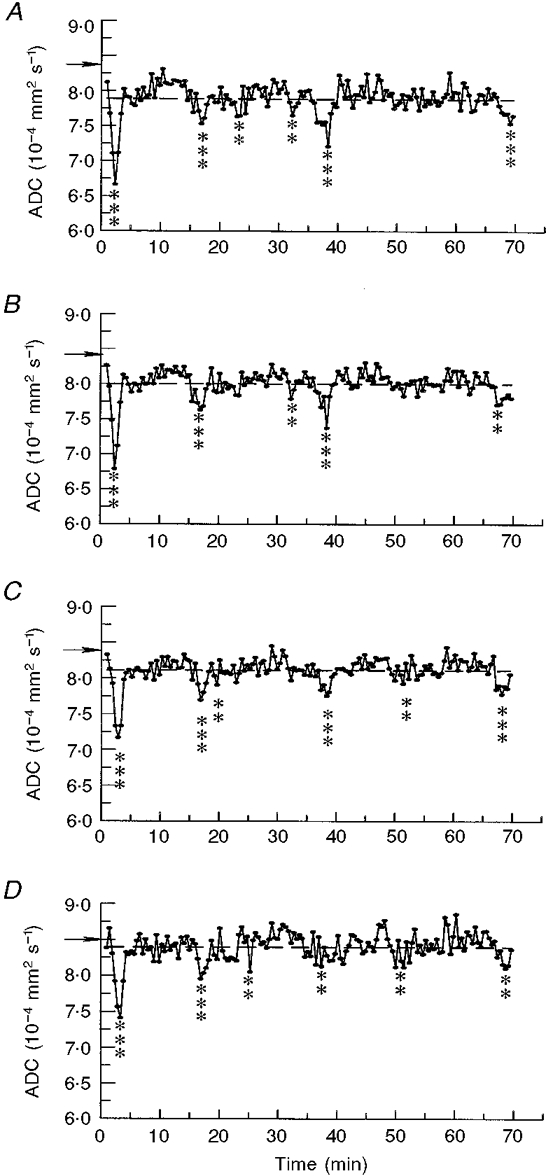
A-D, average ADC values were calculated from the 4 ROIs shown in Fig. 3A-D. Asterisks indicate ADC values significantly decreased from the mean of all time points (indicated by the horizontal dashed line) (**≥ 2 s.d.s, ***≥ 3 s.d.s); ADC decreases coincided with negative DC potential deflections indicating CSD passage; horizontal arrows indicate reference ADC values from the same areas before KCl application.