
Figure 6. Correlations between DC potential, ADC and BOLD changes.
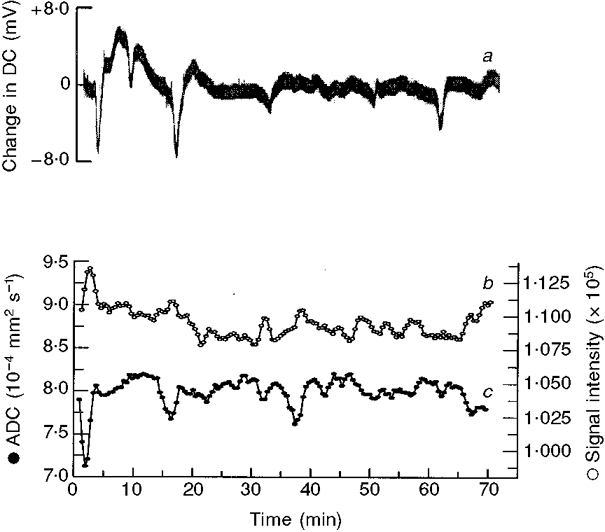
Changes in the DC potential (a) recorded at the brain surface following application of KCl; variation in the apparent diffusion coefficient (ADC; c) and the BOLD signal measuring haemoglobin oxygenation (b), within a single ROI. Comparison of the ADC and BOLD signals demonstrates an inverse correlation and good temporal superposition. ADC and BOLD traces (c and b) were subject to a 3-point running-mean smoothing procedure to improve definition and show that BOLD activation (increased signal intensity) occurs slightly later than ADC decreases.