
Figure 2. Glucose concentration and production.
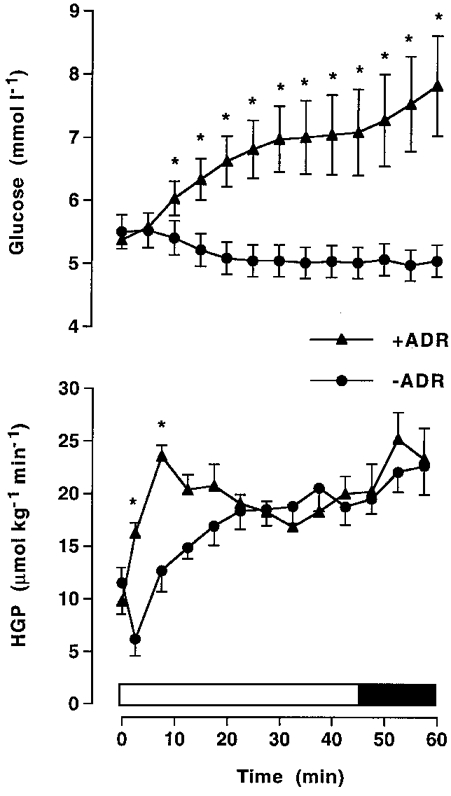
Plasma glucose and hepatic glucose production (HGP) during cycling exercise at 68 %VO2,max for 45 min, followed by 15 min at 84 %VO2,max in adrenalectomised subjects with saline (–ADR) or adrenaline (+ADR) infusion commencing at the onset of exercise and increased after 45 min. Values are means ±s.e.m. (n = 6). * Significantly different (P < 0.05) from –ADR.