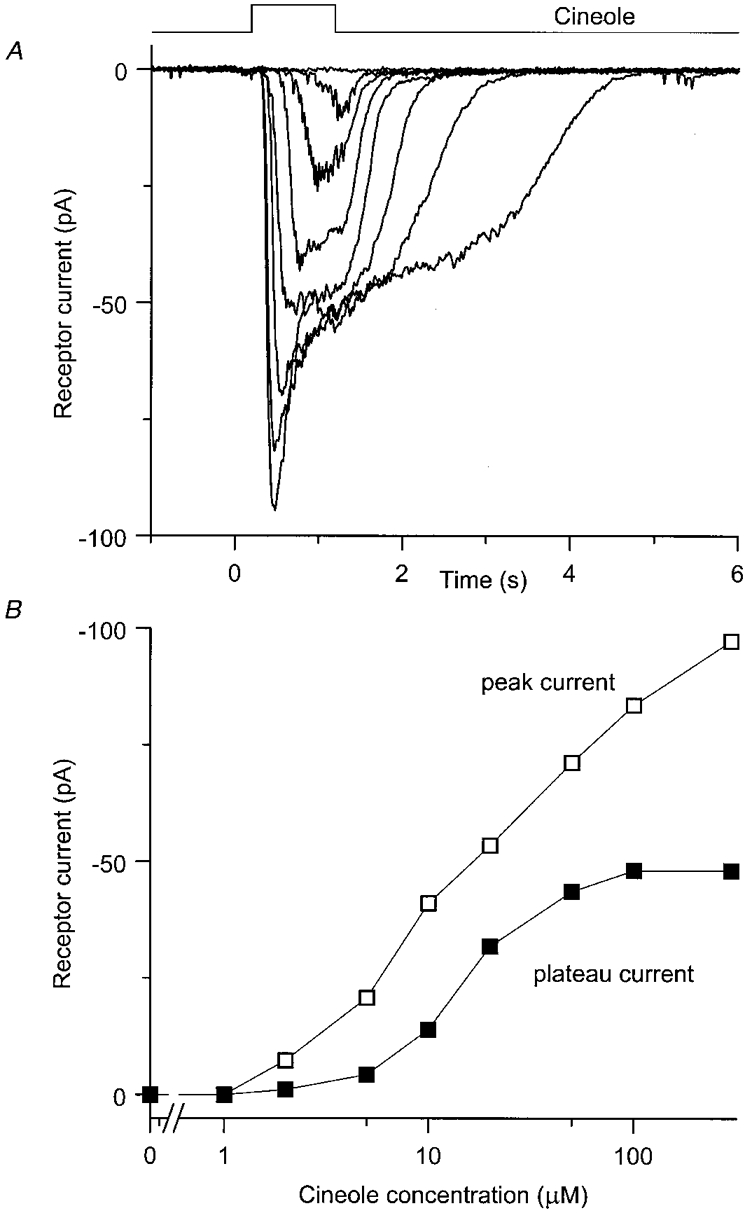
Figure 2. Receptor current responses of an olfactory receptor cell.

A, superimposed suction pipette current responses to 1 s stimulation with cineole at concentrations of 1, 2, 5, 10, 20, 50, 100 and 300 μm, low-pass filtered at 20 Hz so as to display only the receptor current. Each trace is the mean of two trials; same cell as Fig. 1. Top trace represents the timing of the solution change. B, dose-response relations derived from the data of A.□, measured at response peak; ▪, represent plateau current, measured at 1.05 s after stimulus onset.
