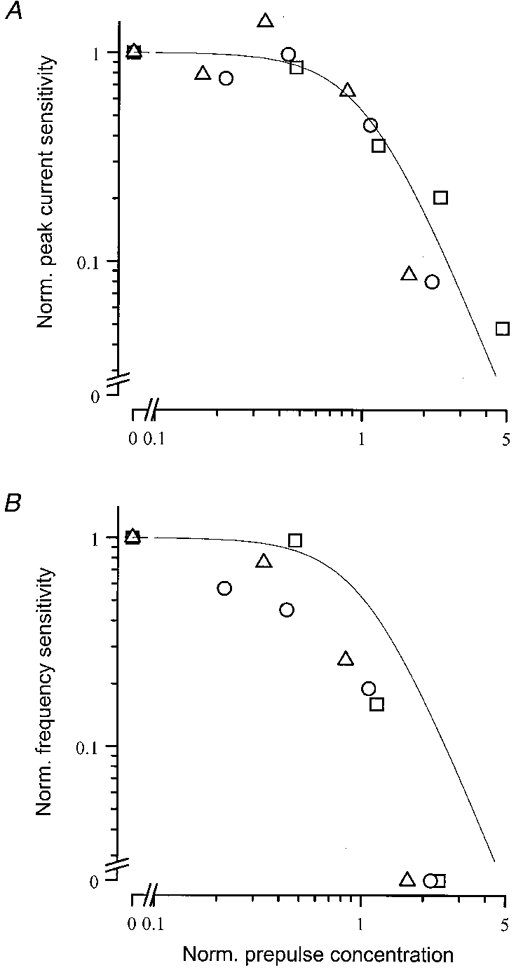
Figure 7. Sensitivity as a function of adapting pre-pulse concentration.

Sensitivity derived from the peak receptor current response (A) and from the spiking response (B) Sensitivity has been calculated from the dose-response relation for each cell by dividing a 20 % response criterion by the increment above the pre-pulse concentration of the test pulse required to evoke it. Sensitivity has been normalised for each cell to that in the absence of the pre-pulse. Pre-pulse concentration has been normalised in both panels according to the pre-pulse concentration which reduced current sensitivity by a factor of two. Continuous curve fitted to the peak current sensitivity data in A is a modified Weber relation (eqn (2)) with an exponent of 2.4 and normalised to unity; this curve is replotted in B for ease of comparison. Cell of Figs 4–6 is represented by □.
