
Figure 3. Typical PCr and intracellular pH (pHi) kinetics as well as the relationship between Veff and ΔpH during the recovery from 30 s of maximal rate exercise.
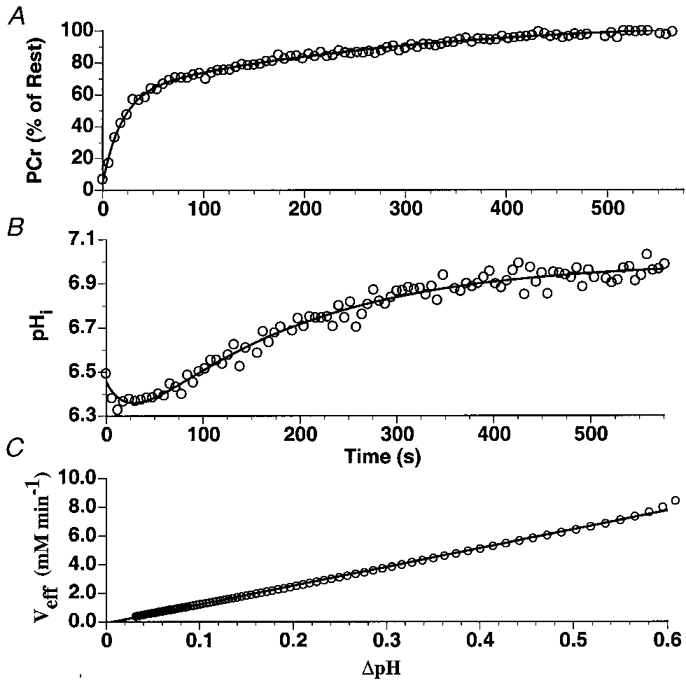
The PCr (A) and pHi (B) kinetics were used to determine PCr utilization rates, buffer capacity, proton efflux rates (Veff; C), oxidative capacity, and glycolytic flux. PCr and pH recoveries were fitted as a sum of exponentials with amplitudes A1 and A2, and rate constants k1 and k2. PCr kinetics were fitted as:
where Rest is the fully recovered PCr level and Depl is the initial PCr level. pH kinetics during recovery were fitted as:
where pHmin is the minimum pH obtained during recovery. Following a period of post-exercise acidification, pHi recovered with an approximate linear rate of 0.13 pH units min−1 and with a rate constant of 0.34 min−1. Based on the Veff kinetics following the post-exercise acidification period (C) the peak efflux rate was 8.4 mM min−1 and λ was determined to be 13.1 mM (pH unit)−1 min−1.