
Figure 6. ATP provisions in the medial gastrocnemius during maximal rate exercise.
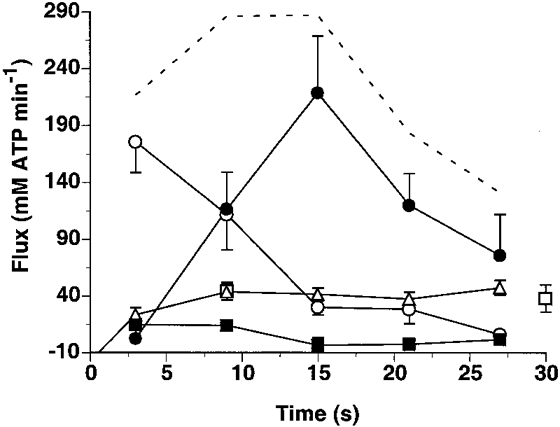
ATP flux as supplied by creatine kinase (○), aerobic metabolism (□, measured; ▵, calculated), glycogenolysis (•) and net ATP breakdown (▪). The dashed line represents total ATP flux. Data are means ±s.e.m.