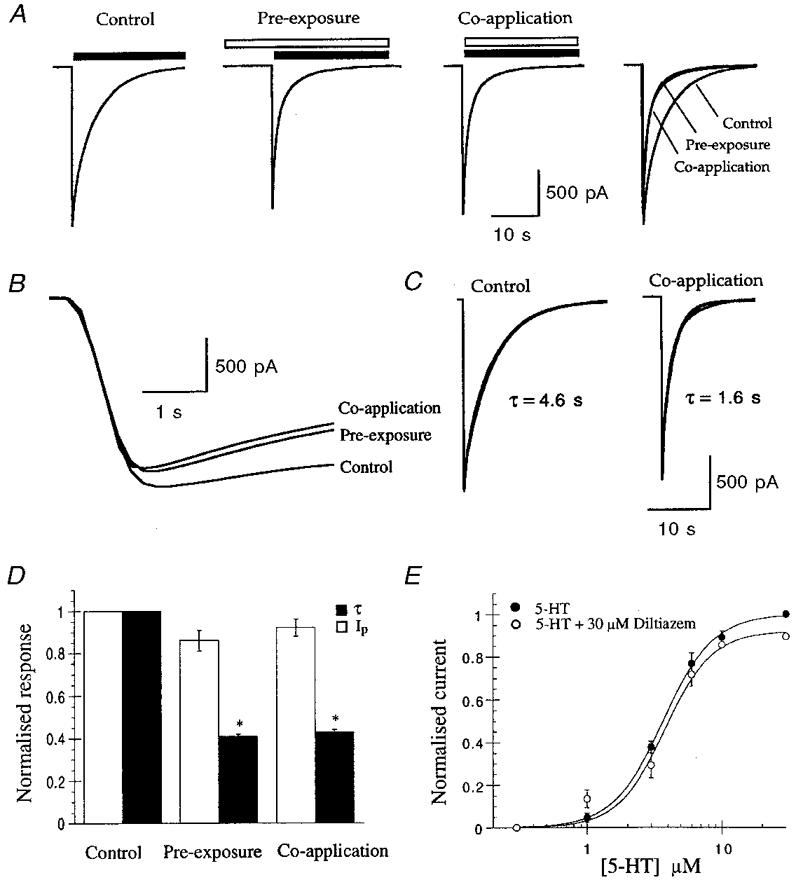
Figure 2. Diltiazem inhibition of the 5-HT3 receptor.

A, whole-cell currents recorded in response to application of 5-HT (30 μm, filled bar) with or without diltiazem (10 μm, open bar). The extent and time course of inhibition were not affected by pre-exposure to 10 μm diltiazem, as indicated by overlay of the traces. Results are from one experiment and are typical of three others. B, data from A on an expanded time scale showing that there was no difference in the rise time of the response in the presence or absence of diltiazem. These data also demonstrate that the rise time was slower than the solution exchange time shown in Fig. 1. C, 5-HT-evoked control responses were well fitted by monoexponential functions. In this example τ was 4.6 s for the control and 1.6 s in the presence of diltiazem. D, normalised data for the experiments illustrated in A.* Significantly different from control, n = 3. E, diltiazem did not affect the dose-response curve for 5-HT activation of the receptor. The curve fits show the best fit of the Hill equation, which yielded an EC50 of 3.7 and 4 μm and a Hill coefficient of 2.3 and 2.6 for experiments conducted in the presence and absence of 30 μm diltiazem, respectively.
