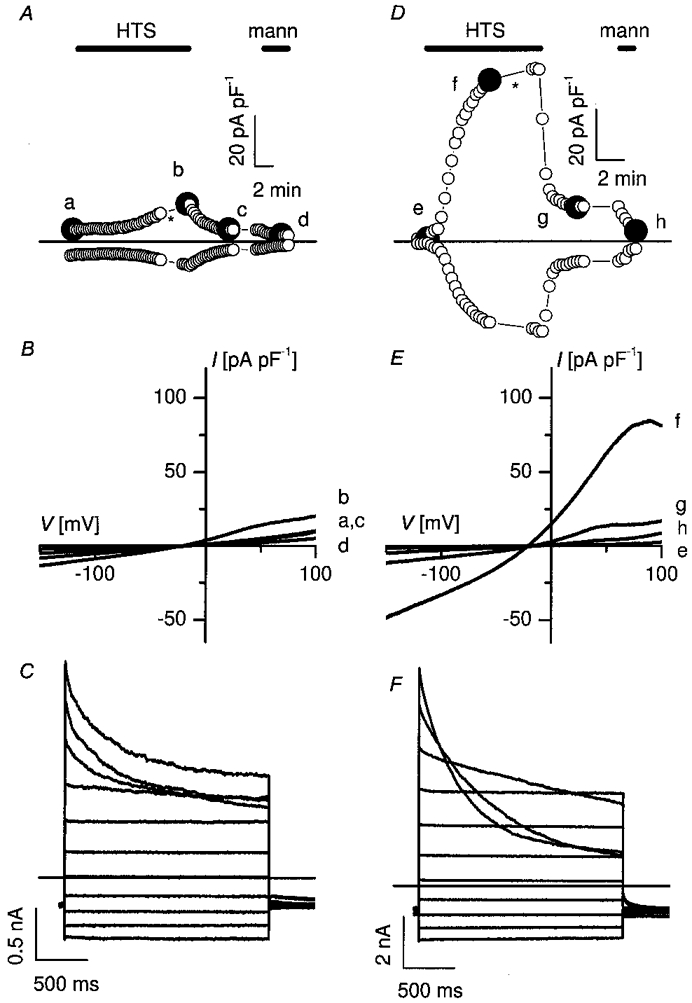
Figure 2. Transfection of caveolin-1 in Caco-2 cells restores ICl,swell.

Membrane currents before, during and after 25 % hypotonic stimulation (HTS) were recorded in a non-transfected Caco-2 cell (A-C) and in a Caco-2 cell transfected with caveolin-1 (D-F). A and D, time course of the current at +50 mV (upper trace) and at −100 mV (lower trace). During hypotonic stimulation (HTS), control cells developed only a small current with time (A), whereas in transfected cells a pronounced increase in membrane current is observed (D). The HTS-induced changes are reversible upon returning to isotonic conditions and completely disappear upon perfusion with a hypertonic solution (mann). B and E, I-V curves taken at the times marked by the filled symbols in A and D. The current-voltage relation of the membrane current at time zero in a typical control cell (a) and in a transfected cell (e) is compared to the respective I-V curves recorded during the plateau phase of the HTS-activated membrane current in the same control cell (b) and transfected cell (f). After switching back to isotonic conditions, the current returned to nearly control level (c and g). After application of a hypertonic mannitol solution (mann) the current reached its basal level (d and h). C and F, current traces during voltage steps applied at the time indicated by the asterisk in A and D. Note the different current scales. Voltage protocol: holding potential at −50 mV, steps between −100 and +100 mV, increment +20 mV.
