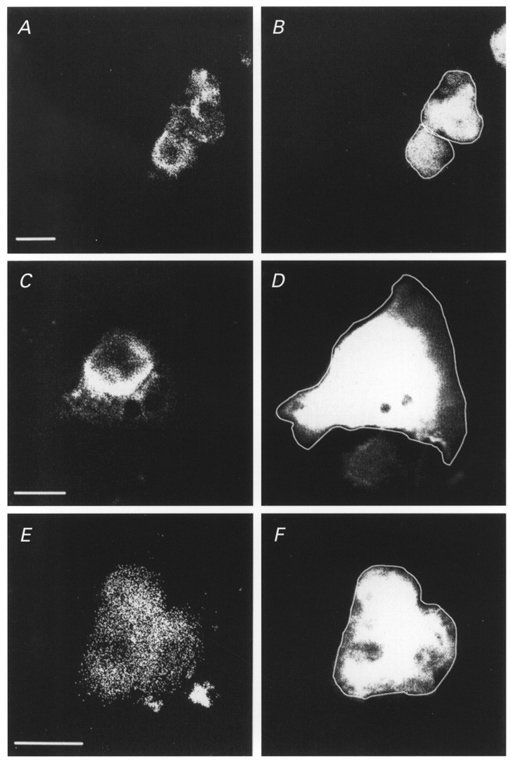
Figure 4. Immunofluorescence of Caco-2 cells transfected with caveolin-1 isoforms.

Caco-2 cells were transfected with the bicistronic GFP expression vector containing caveolin-1 (A and B), −1α (C and D) or −1β (E and F). The GFP fluorescent signal (B, D and F) was used to identify transfected cells and to define the cell border (white superimposed line in GFP panels). Caveolin-1 isoforms were visualised using a non-discriminating monoclonal antibody (A, C and E) and phycoerythrin-conjugated secondary antibodies. Images representative for the different conditions indicate that caveolin-1, −1α and −1β are expressed. In addition, the subcellular distribution of caveolin-1α seems to be restricted to the perinuclear region, whereas the caveolin-1 and caveolin-1β signals reach the cell periphery. Scale bar corresponds to 10 μm in all panels.
