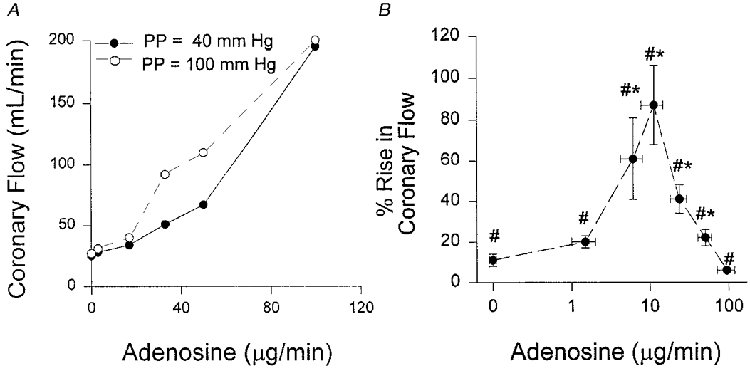
Figure 2.

A, example of adenosine-coronary flow dose-response curve at both 40 and 100 mmHg pulse pressure from one animal. There is a leftward shift of the curve at higher PP. B, group data showing percentage increase in coronary flow due to a change in PP at different adenosine doses. Increasing PP resulted in a rise in mean coronary flow at all levels of adenosine infusion (# P < 0.05). Furthermore, at multiple doses, adenosine amplified the PP-flow response (* P < 0.05) to a maximum almost 90% above that of the control (see Methods for concentrations). This dose modestly elevated basal flow (+47%) at a resting PP of 40 mmHg.
