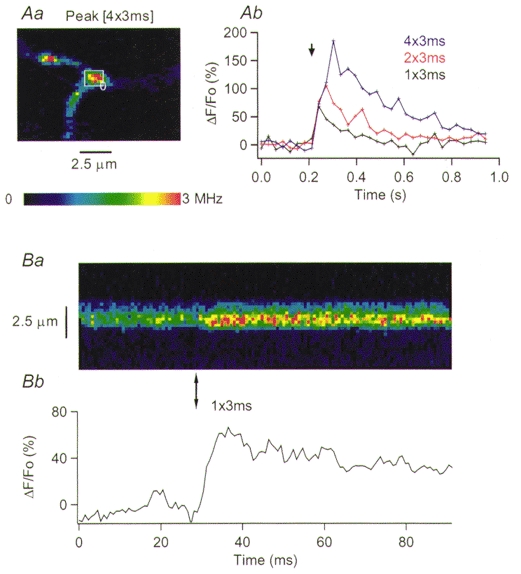
Figure 2. Action potential-evoked [Ca2+]i rises in an axonal branch point.

Aa, pseudocolour image from a scan of 13 μm × 9 μm and 30.4 ms dwell time, obtained at the peak of the response to a train of four action potentials. The rectangle indicates the area analysed in Ab, where the time course of the ΔF/Fo signals elicited by one, two and four action potentials is plotted as a function of time. Ba, pseudocolour image of a line scan through the centre of the branch point. The vertical arrow below the image marks the time when a single action potential was delivered. Bb plots the time course of the ΔF/Fo values. The pseudocolour calibration bar in A applies also to the line scan image shown in B.
