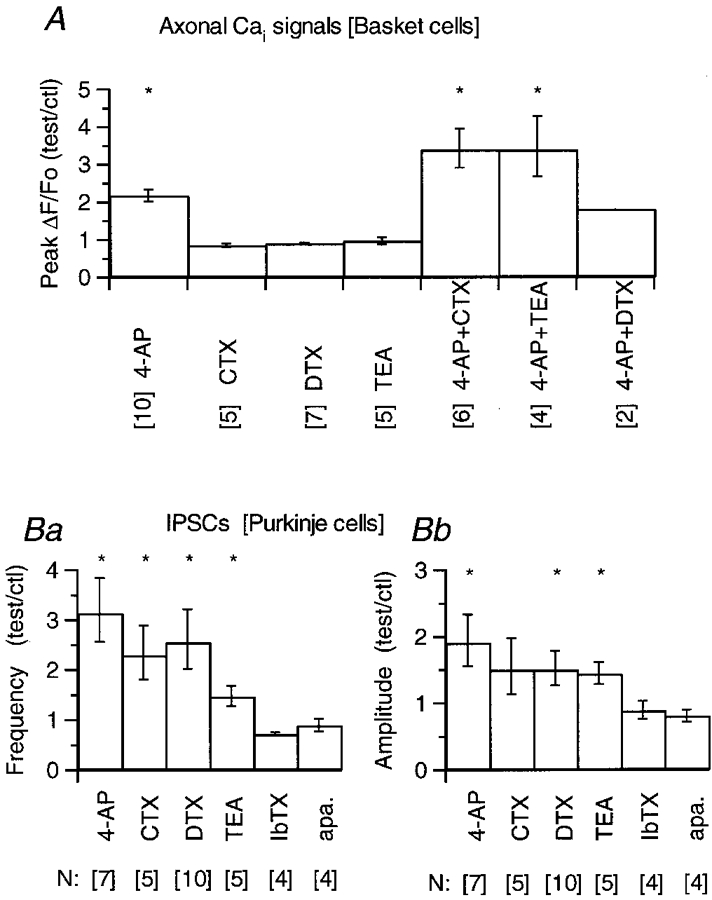
Figure 8. Summary of the effects of K+ channel blockers on Purkinje cell IPSCs and in basket cell axonal [Ca2+]i signals.

A, basket cell axonal intracellular calcium (Cai) signals: all data included in this pool were obtained using trains of four action potentials. In each cell, three to six ROIs were analysed, and for each ROI the ratio of the peak ΔF/Fo value in the drug over that in control was calculated. When the effect of the drug faded with time (as in the experiment shown in Fig. 6 for the combined action of CTX and 4-AP) the value taken was that of the maximum. The ratios from all the ROIs for each cell were averaged, and these averages were pooled to yield the mean values given in each histogram. The 4-AP group includes three cells tested at 0.25 mm and 7 at 2.5 mm; the effects were not different at these concentrations (see text). αDTX and CTX were used at 100 nM, TEA at 2.5 mm. In the groups of CTX, TEA and αDTX plus 4-AP, the 4-AP concentration was 0.25 mm. The error bars represent s.e.m.B, IPSCs were recorded from Purkinje cells in the presence of 10 μm NBQX, 100 μm APV and, in some experiments, 1 μm bicuculline; no bicuculline was added in any of the experiments testing for effects of apamin (see Methods). Currents were acquired during 3–6 min in control saline and during a period of 6–10 min after the drug was added to the bathing solution. For each cell, the ratio of the mean frequency and mean amplitude in the drug over that in control was calculated. These ratios were averaged and are plotted in Ba and b. The error bars represent s.e.m. In A and B the numbers in brackets below the name of each drug correspond to the number of cells included in the pooled analysis. An asterisk on top of a bar denotes that the mean value was significantly different from 1 at the P < 0.05 level (Student's t test).
