
Figure 3. Frequency-dependent increases in CeBF and [K+]o in response to parallel fibre stimulation.
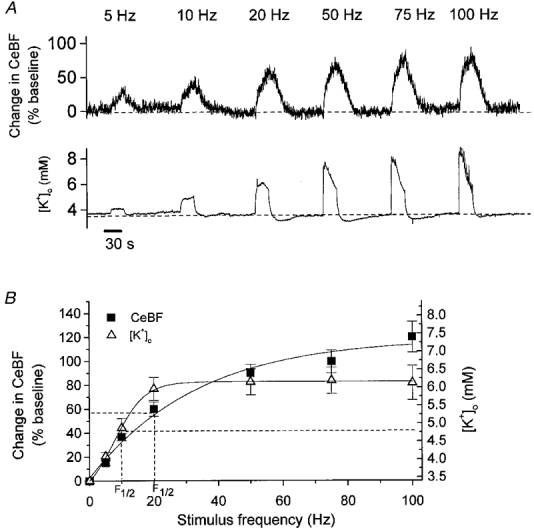
A, typical example of CeBF and [K+]o increases evoked by parallel fibre stimulation at 5, 10, 20, 50, 75 and 100 Hz for 30 s. Upper panel shows original recordings of CeBF increases as a percentage of the baseline value. Lower panel shows simultaneous [K+]o traces (mm). Bar (at bottom) indicates the duration of stimulation. B, CeBF and [K+]o increases plotted versus stimulation frequency (n = 9). Increases in CeBF are shown on the ordinate to the left as percentage increases of baseline, while maximal values to which [K+]o increased are shown on the ordinate to the right. The smooth curves represent sigmodial curve fitting. The dashed lines show the frequencies at which the half-maximum increase occurred (F½).