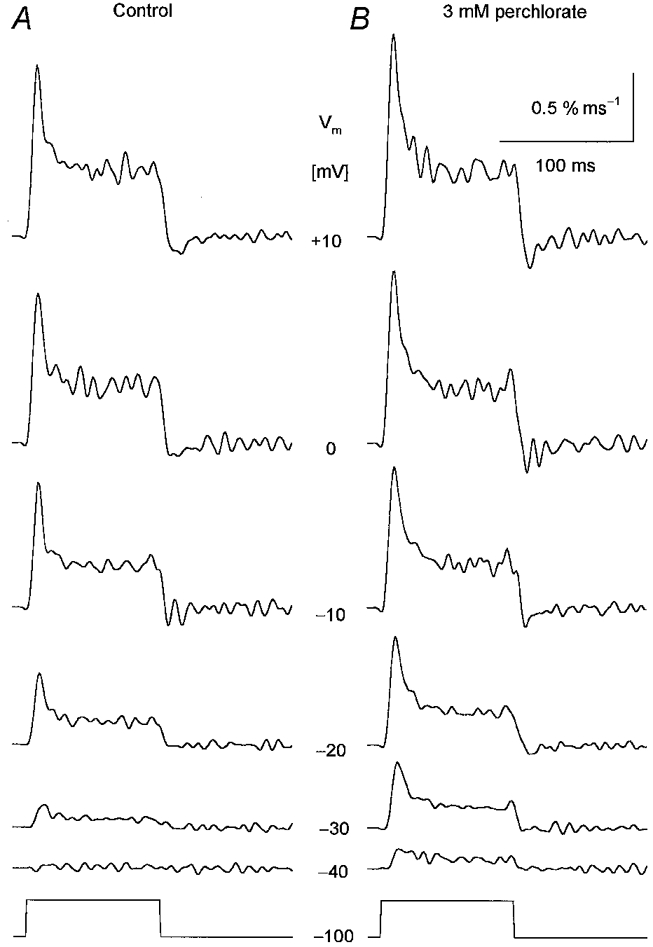
Figure 2. Perchlorate induced alterations in SR permeability at different membrane potentials.

Changes in SR permeability were calculated from the calcium release records using the SR content estimated under control conditions. A, SR permeability in the absence of the drug. B, SR permeability after the addition of 3 mm perchlorate. Note that the drug enhanced the calculated permeability increase at every voltage tested. The membrane potentials during the 100 ms long depolarizations are indicated next to the traces. [APIII]= 735-881 μm, [fura-2]= 83-108 μm. Parameters of the removal model: koff,Mg-P = 8.5 s−1, PVmax = 1.86 mm s−1, kon,Ca-E = 1.1 μm−1 s−1, koff,Ca-E = 2.4 s−1. C0 = 1.5 mm.
