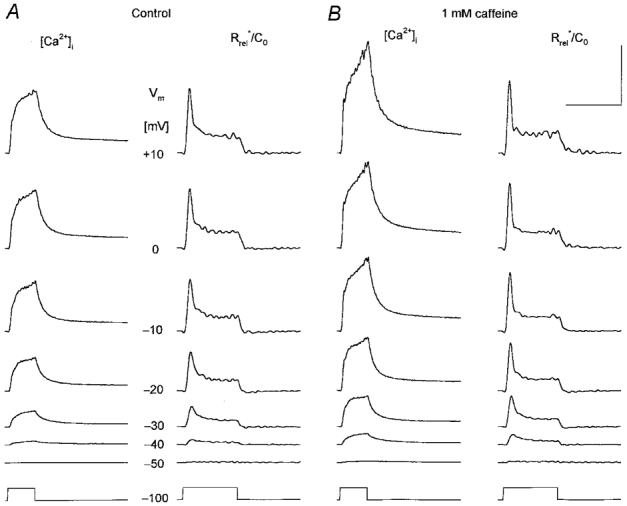
Figure 3. Caffeine potentiates calcium transients and the depolarization-induced SR permeability increase.

A, changes in intracellular calcium concentration ([Ca2+]i) and in SR permeability (Rrel*/C0) under control conditions at a wide range of membrane potentials as indicated for each row. The depolarization lasted for 100 ms for all traces (bottom trace). B, the effect of 1 mm caffeine on [Ca2+]i and on Rrel*/C0. Note that caffeine enhanced both the calcium concentration increase and the calculated SR permeability change at all voltages tested. Calibration bars for [Ca2+]i and Rrel*/C0 are, respectively: horizontal, 200 and 100 ms; vertical, 1 μm and 1 % ms−1. [APIII]= 829-930 μm, [fura-2]= 159-163 μm. Parameters of the removal model: koff,Mg-P = 2.2 s−1, PVmax = 3.9 mm s−1, kon,Ca-E = 0.9 μm−1 s−1 and koff,Ca-E = 5.8 s−1. C0 = 2.5 mm.
