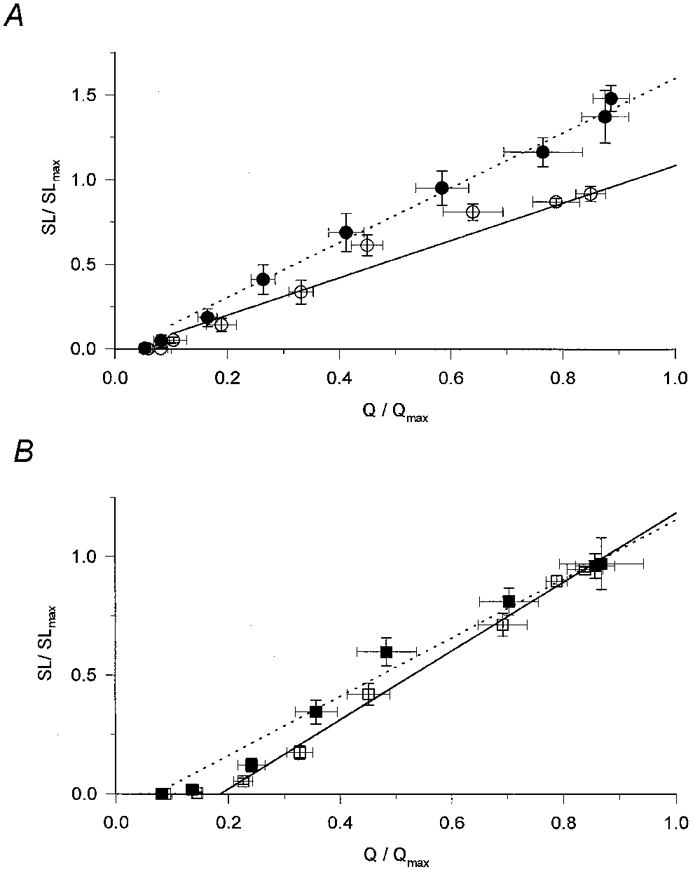
Figure 8. Transfer functions in the presence of perchlorate and caffeine.

To calculate the transfer function the normalized and averaged steady SR permeability (SL/SLmax) was plotted as a function of the normalized and averaged charge (Q/Qmax). Superimposed lines represent the least squares fit of a straight line to the data points (7 points) above the threshold for the appearance of an SR permeability increase in reference conditions (continuous lines) and in the presence of the drugs (dotted lines). A, transfer function in the absence (○) and presence (•) of perchlorate. Note the increased slope (m). Parameters of the straight lines for reference conditions and in the presence of perchlorate are, respectively: m = 1.212 and 1.627, the threshold charge (Qth, the x-axis intercept) = 0.026 and 0.012, regression coefficient (r2) = 0.963 and 0.991. B, transfer functions in the absence (□) and presence (▪) of caffeine. Parameters of the straight lines for reference conditions and in the presence of perchlorate are, respectively: m = 1.454 and 1.242, Qth = 0.185 and 0.070, r2 = 0.993 and 0.982.
