
Figure 1. Characterization of glycine-evoked currents in LSO neurones.
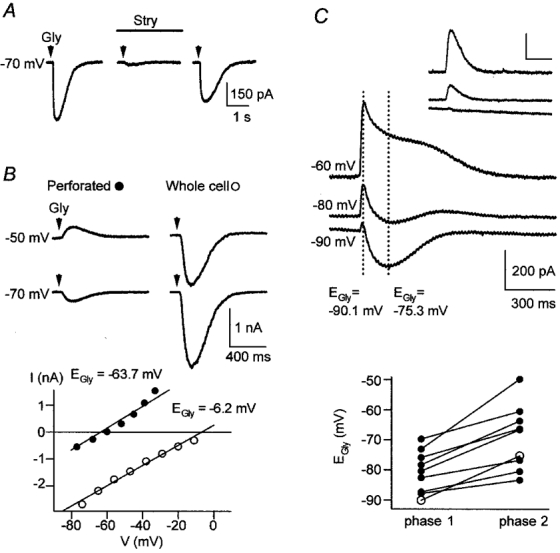
A, glycine-evoked currents were reversibly blocked by bath application of strychnine. Glycine-evoked currents obtained in a whole-cell recording of a P3 neurone with 32 mm[Cl−]p and Vs =−70 mV before, during and after application of 0.5 μm strychnine. The glycine response recovered to 68 % of control after 20 min washout. B, EGly depended on the recording configuration. The upper panel shows glycine-evoked currents recorded in a P7 neurone in gramicidin perforated-patch configuration (left) and, after membrane rupture, in whole-cell configuration (right), at Vs =−50 and −70 mV. The corresponding I-V relations in the lower panel illustrate that EGly changed from −63.7 mV in perforated-patch recording (•, Vs =−80 to −20 mV, ‘up’ protocol) to −6.2 mV in the subsequent whole-cell recording (○, Vs =−80 to −10 mV, ‘up’ protocol). During whole-cell recording, the [Cl−] in the pipette and bath solution were about equimolar (132 vs. 133.5 mm). C, biphasic glycine-evoked currents were seen in perforated-patch recordings of some P8-11 neurones. The upper panel shows biphasic currents recorded from a P10 neurone at Vs =−90, −80 and −60 mV; glycine was applied for 20 ms. The same neurone displayed monophasic currents in response to briefer applications (5 ms, inset). Scale bars are identical in the main panel and inset. Dotted lines mark the time when current amplitudes were measured to determine EGly of phase 1 (−90.1 mV) and phase 2 (−75.3 mV). The lower panel shows a summary of all 9 neurones displaying biphasic glycine responses; ○, results from the neurone shown in the upper panel. EGly of phase 1 was always more negative than that of phase 2 (−80.6 ± 2.3 vs.−69.2 ± 3.6 mV).