
Figure 3. [Cl−]i determines the polarity and amplitude of glycine responses.
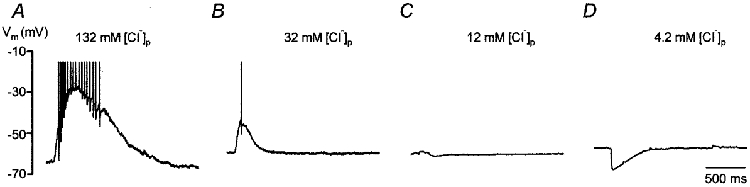
Examples of glycine-evoked membrane potential changes observed in four neurones recorded in whole-cell configuration with different [Cl−]p. A, a P9 neurone recorded with 132 mm[Cl−]p had a calculated EGly of −0.3 mV; it was strongly depolarized and a train of 17 spikes was evoked within 560 ms. B, a P8 neurone recorded with 32 mm[Cl−]p had a calculated EGly of −36.7 mV; it was less depolarized than the neurone shown in A and a single spike was evoked. C, a P3 neurone recorded with 12 mm[Cl−]p had a calculated EGly of −61.9 mV; it showed a very small hyperpolarization. D, a P3 neurone recorded with 4.2 mm[Cl−]p had a calculated EGly of −88.9 mV; it was hyperpolarized. Spikes in A and B are truncated. Same time scale for A-D.