
Figure 1. Effects of dialysing RBL-1 cells with different concentrations of Ca2+ chelators.
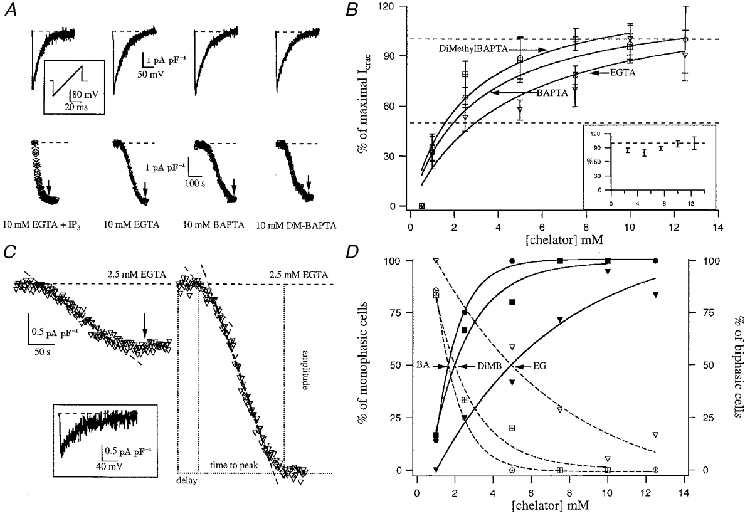
A shows ramp currents (upper panel) and the time course of ICRAC (measured at -80 mV; lower panel) following dialysis with 30 μm InsP3 (IP3) + 10 mm EGTA (active depletion) or 10 mm EGTA, BAPTA or dimethyl (DM)-BAPTA (passive depletion). The inset shows the ramp protocol (-100 to +100 mV in 50 ms at 0.5 Hz). B plots the concentration-ICRAC relationship for the different chelators. Cells that did not respond have not been included in the analysis. The inset represents the dose-response curve for all cells that generated a biphasic current (see text for detailed description). C shows typical monophasic (left-hand panel) and biphasic currents (right-hand panel) that were obtained by dialysis with 2.5 mm EGTA. The inset shows the ramp current taken at the arrow, when ICRAC had reached steady state. The right-hand panel shows the parameters that we measured. D shows the relationship between chelator concentration and the percentage of cells that responded by generating either a monophasic or biphasic ICRAC. As chelator concentration increases, so does the fraction of cells that respond with biphasic ICRAC. EG, EGTA; BA, BAPTA; DiMB, dimethyl BAPTA.