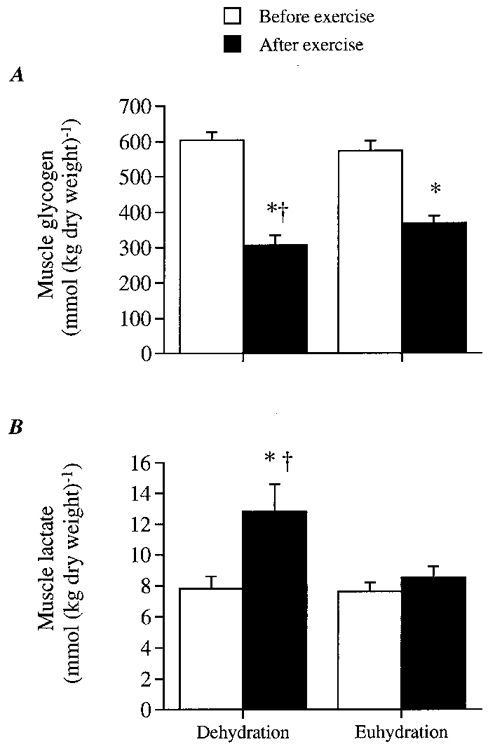
Figure 4. Glycogen and lactate content of vastus lateralis muscle during dehydration and control trials.

A, muscle glycogen content; B, lactate content. * Significantly different from 20 min value, P < 0.05. † Significantly different from control, P < 0.05.
