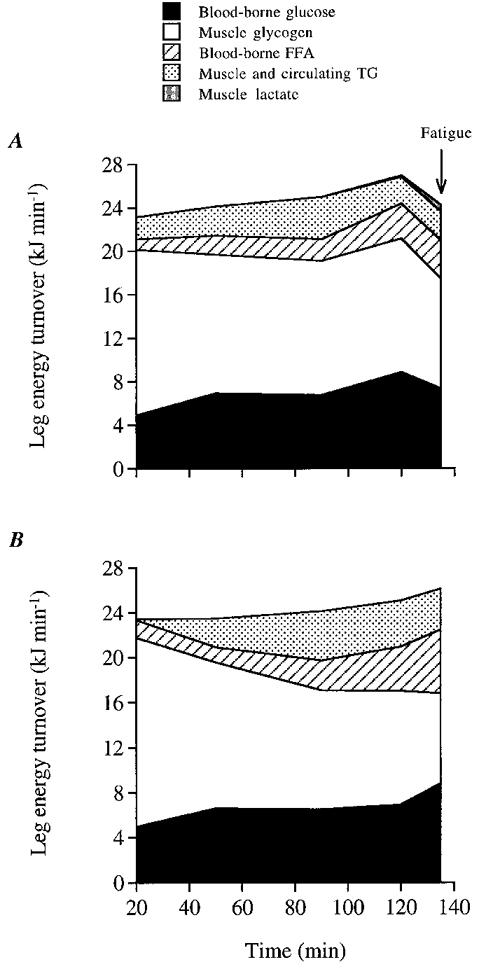
Figure 5. Estimated maximal contribution of blood-borne glucose and FFA, and minimal contribution of intramuscular glycogen and circulating and muscle triacylglycerol (TG) to total leg energy production.

Levels throughout the dehydration (A) and control (B) trials. Lactate contribution was estimated by adding net leg lactate release and net muscle lactate accumulation. The latter was estimated assuming an active muscle mass in the leg of 5 kg and correcting for the lactate release (≈1.5 mmol) occurring during the 2-4 min before the biopsy was obtained (Bangsbo et al. 1994).
