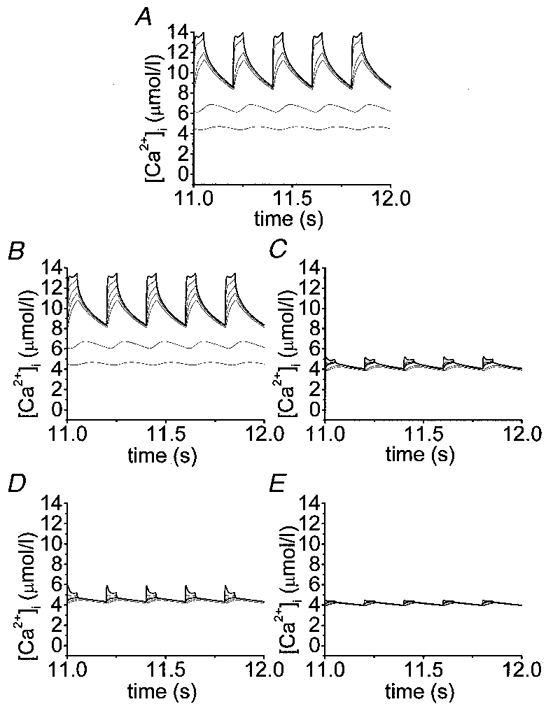
Figure 5. Detailed effects of exogenous Ca2+ chelators with similar affinity and different forward binding constant on [Ca2+]i.

Simulation of time courses of cytosolic Ca2+ transients after reaching the steady state (last 5 pulses of a train of 60 potential-like depolarizations; 50 ms each separated by 150 ms). Different profiles in each panel correspond to Ca2+ transients at shells positioned 0.05 (outermost, represented as bold trace), 0.2, 0.4, 0.6, 0.8, 2.0 and 2.5 μm beneath the membrane. Other parameters are as in Table 1. In addition to the endogenous fixed buffers (A), the effects of 853 μmol l−1 EGTA (B), 927 μmol l−1 BAPTA (C), 1280 μmol l−1 Calcium Orange-5N (D) and 1416 μmol l−1 Calcium Green-5N (E) have been simulated as indicated.
