
Figure 1. Time course of sodium current inhibition by DHA in an adult rat ventricular myocyte.
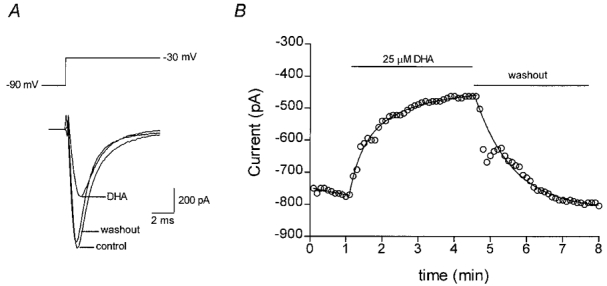
A, depiction of the voltage step (upper panel) and the current evoked by a step in membrane potential to −30 mV from a holding potential of −90 mV (lower panel) and following incubation in DHA (25 μM) and subsequent washout. B, time course of the inhibitory effect of DHA on the peak sodium current recorded from an adult rat ventricular myocyte. Sodium currents were evoked in whole-cell recording mode once every 6 s with 300 ms duration pulses to −30 mV from a holding potential of −90 mV. The horizontal bars indicate the period during which DHA was applied to the cell or the period of washout with a solution containing 1 mg ml−1 delipidated BSA.