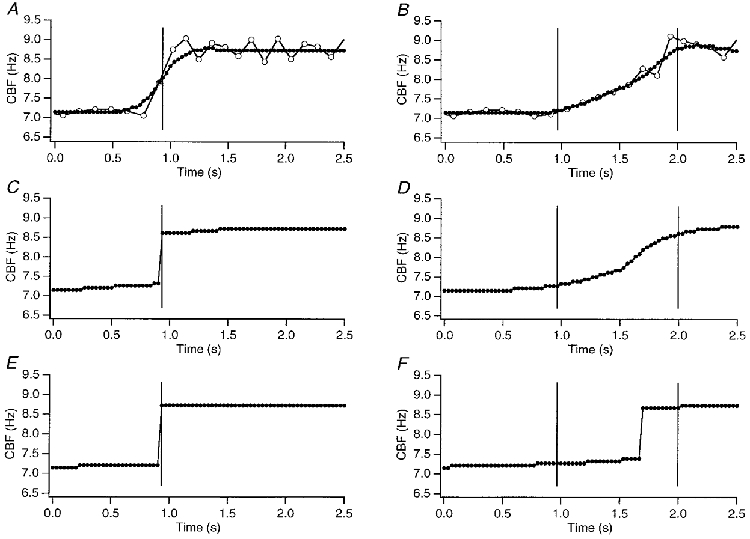
Figure 3. Analysing the intensity signal with FFT of ‘sliding’ Hanning windows.

To assure accuracy of CBF estimates with respect to frequency and the time course of frequency changes using the ‘sliding’ Hanning window FFT approach (see Methods), we simulated intensity data using a sine function. Two scenarios were tested: an instantaneous change from 7.2 to 8.5 Hz (A, C and E) and a gradual change from 7.2 to 8.5 Hz over 1.033 s (B, D and F). All Hanning windows were advanced through the data set by one video frame. The Hanning window size was selected to contain 32 video frames (A and B), 64 video frames (C and D), or 128 video frames (E and F). The open circles in A and B represent the peak-to-peak CBF estimates of the simulated intensity data. Hanning windows with 64 video frames provided the most accurate CBF estimates (C for instantaneous change, D for gradual change). A data window with 32 video samples distorted the immediate change to look gradual, whereas windows with 128 video samples underestimated the duration of the gradual change and indicated a delay of 0.7 s from the start of the increase.
