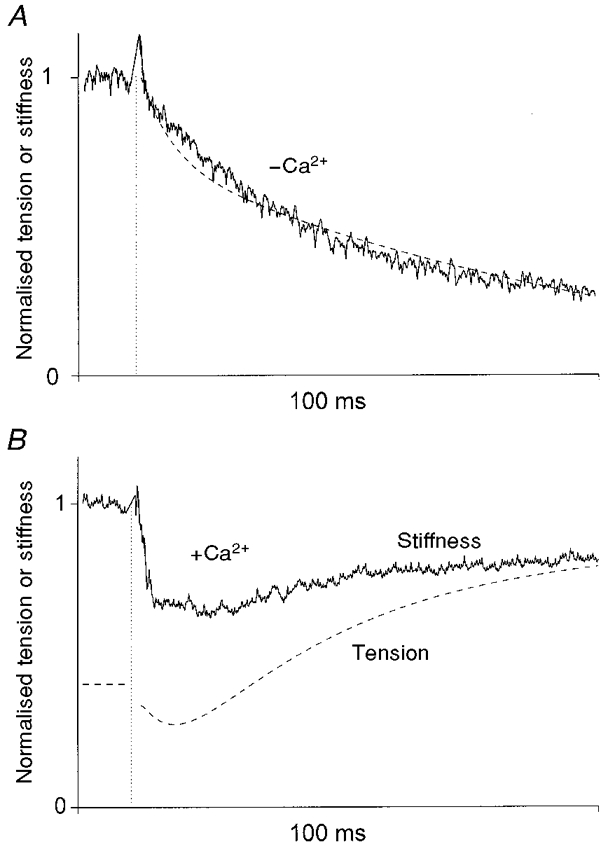
Figure 3. Stiffness changes initiated by the photolytic release of 1.1 mM ATP from 10 mM DMB-caged ATP in the absence (A) and presence (B) of Ca2+ in single frog muscle fibres slightly EDC cross-linked.

Continuous lines represent fibre stiffness extracted from the tension responses to 1 kHz sinusoidal length changes (0.2 % of the fibre length peak-to-peak), as described in the text and normalised for rigor stiffness before the laser flash. The dashed lines show tension smoothed using 1 ms sliding averaging in the same experiments normalised for maximal tension (pre-flash rigor tension in A and maximal isometric tension in B). The traces were interrupted for ≈2 ms when the laser flash perturbed the tension records (vertical dotted lines) making calculation of stiffness impossible. Force decay was described by a double exponential with rate constants of 169 ± 98 and 9.5 ± 17 s−1 (mean ± one standard error of the estimate obtained from the Marquardt-Levenberg algorithm). Stiffness decay was described by a single exponential process of 30 ± 0.8 s−1. Fibre dimensions: A, 3.47 mm × 17 200 μm2; B, 3.55 mm × 13 800 μm2; sarcomere length 2.1 μm for both fibres.
