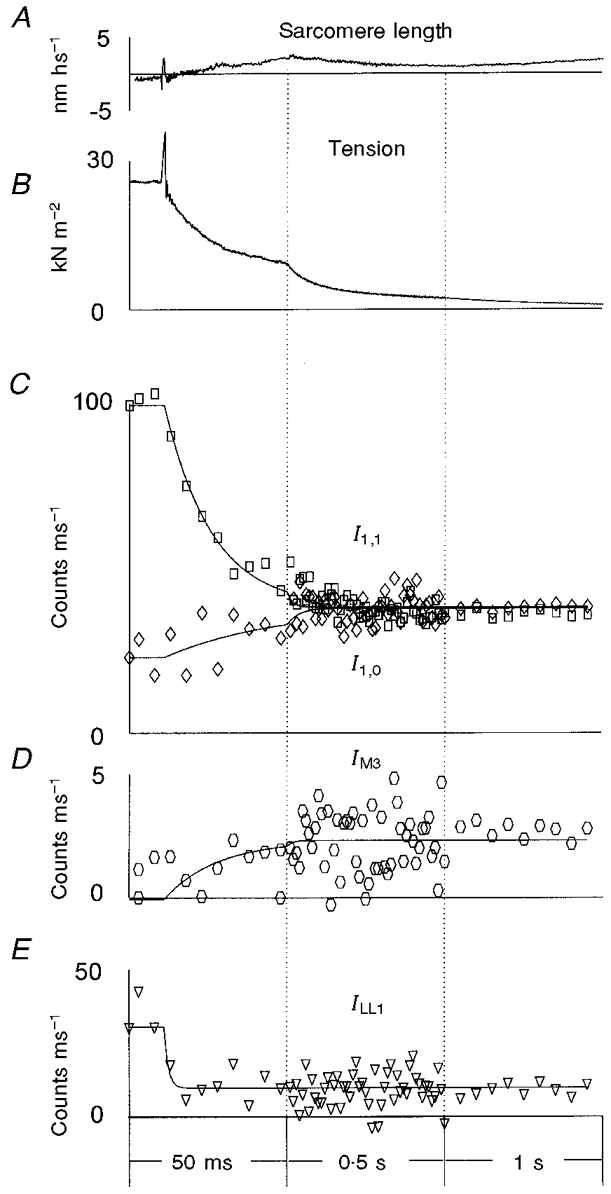
Figure 4. Structural responses following photo-liberation of 1.1 mM ATP from 10 mM DMB-caged ATP in the absence of Ca2+ and in the presence of 50 mM BDM and 20 mM Pi at 5–6 °C.

The time of the laser flash is marked by the movement artefact on the tension trace (B) 10 ms after the beginning of the record. A shows a typical sarcomere length record. As in Figs 5 and 6, the sarcomere length change is expressed in terms of nanometres per half sarcomere (hs), as the half sarcomeres are the functional elements arranged in series. B shows the averaged tension change for 28 runs of the protocol in 8 frog muscle fibres. Four of these 8 fibres were slightly cross-linked with EDC; 4 were not cross-linked. A further 4 experiments included the application of oscillations to the fibre for the determination of stiffness. These are not included in the data shown in B. The X-ray intensities (I) from the 32 experiments in the same fibres were added together and expressed as counts on the detector per millisecond. Data are shown in C-E: the intensity of the equatorial X-ray reflections, I1,0 (⋄) and I1,1 (□) (C); the intensity of the meridional reflection at (14.5 nm)−1, IM3 (D); and the intensity of the myosin-actin layer line, ILL1 (E). The time frames of the X-ray data collection varied from 1 ms before and just after the laser flash, to 10 ms near the plateau of relaxation. In C-E, the 1 ms time frames were averaged into 5 ms time bins during the first 50 ms, for clarity. The averaged values were assigned a time corresponding to the centre of the time interval. The vertical dotted lines show changes in the time scale. In C, the curves are double exponential fits to the time courses of I1,1 and single exponential fit to I1,0. In D, IM3 was fitted with a double exponential function to determine the lag phase and the rate of increase in the intensity. In E, the intensity ILL1 was determined by radial off-meridional integration from (35 nm)−1 to (8 nm)−1 and with subsequent meridional integration and linear background subtraction, so both the first actin layer line at ≈(37 nm)−1 and the first myosin layer line at ≈(43 nm)−1 contributed to ILL1.
