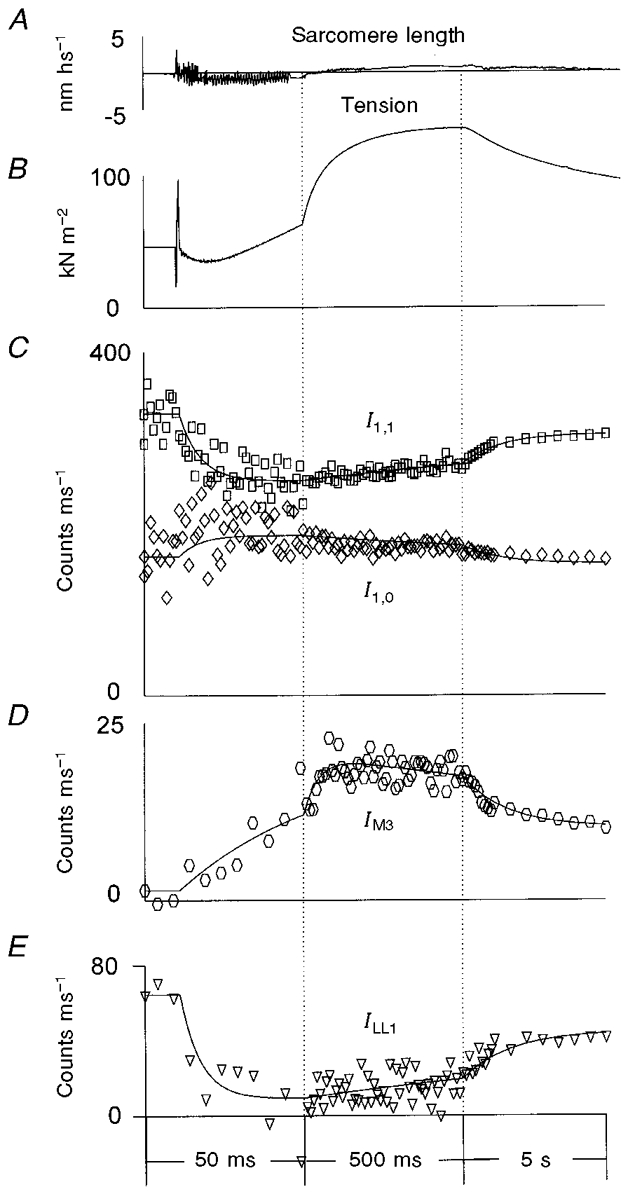
Figure 6. Structural responses following photo-liberation of 0.33 mM ATP from 2 mM DMB-caged ATP in the presence of Ca2+ in single partially EDC cross-linked frog muscle fibres at 5–6 °C.

A, typical sarcomere length record; B, averaged tension transients; C, the intensity of the equatorial X-ray reflections, I1,0 (⋄) and I1,1 (□); D, the intensity of the meridional reflection at (14.5 nm)−1, IM3; E, the intensity of the myosin-actin layer line, ILL1. The tension trace in B was averaged from 48 experiments in 11 muscle fibres; the X-ray data were collected from 54 experiments in the same fibres. The vertical dotted lines show where the time scale was changed. Other details as for Fig. 5.
