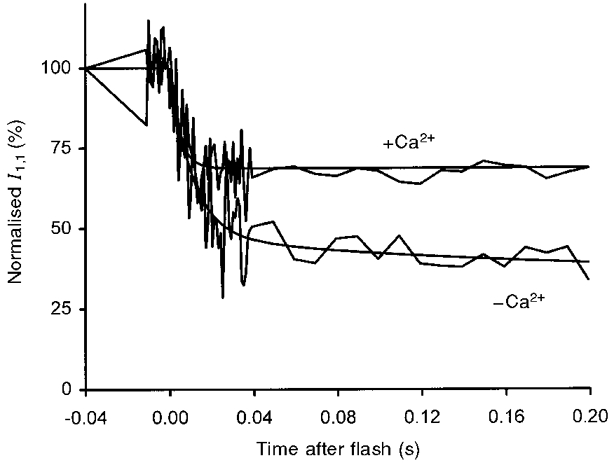
Figure 7. Comparison of the first 0.2 s of the time course of the change in I1,1 obtained in the presence and absence of Ca2+.

The data and exponential traces obtained by regression to the data, shown in Figs 4 and 5, are superimposed. The data were normalised so that the rigor intensities in the presence and absence of Ca2+ were identical. It can be seen that the amplitude of the initial changes in the absence of Ca2+ is greater than that in the presence of Ca2+, pointing to truncation of the underlying process in the latter case, but the changes in the initial 10 ms overlap.
