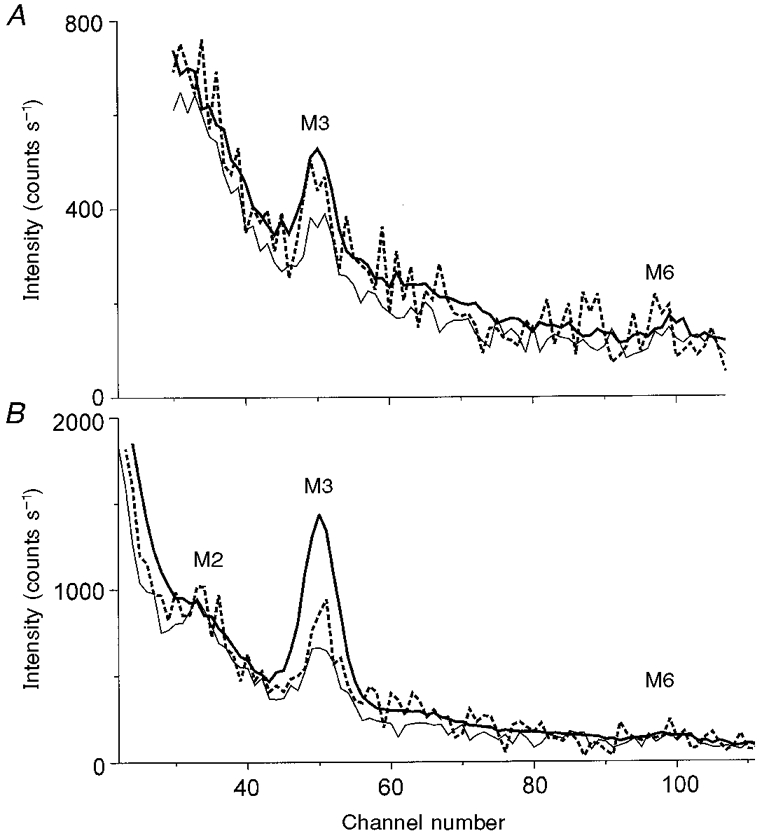
Figure 8. Meridional profile in rigor, immediately following photolysis and in the steady state, in the absence and presence of Ca2+.

A, absence of Ca2+. The data were integrated vertically from -(104 nm)−1 to (104 nm)−1. The pre-flash (Fig. 1A), post-flash (Fig. 1C) and steady state (Fig. 1E) profiles are shown by the thin, dashed and thick lines, respectively. The post-flash data were obtained by summing and scaling for exposure time the data collected 10–60 ms following photolytic release of ATP. The positions of the M3 and M6 reflections are shown; one channel corresponds to (725 nm)−1. B, presence of Ca2+. The meridional profiles of the X-ray intensity before and after flash photolysis of 1 mM ATP in the presence of Ca2+. The data shown in Fig. 1 were integrated vertically from -(104 nm)−1 to (104 nm)−1. The pre-flash (Fig. 1B), post-flash (Fig. 1D) and steady-state (Fig. 1F) profiles are shown by the thin, dashed and thick lines, respectively. The positions of the meridional reflections M2, M3 and M6 are indicated. One channel corresponds to (725 nm)−1. The post-flash data were obtained by summing and scaling for exposure time the data collected in the interval 10–40 ms following photolytic release of ATP.
