
Figure 1. Action of pronase on macropatch If.
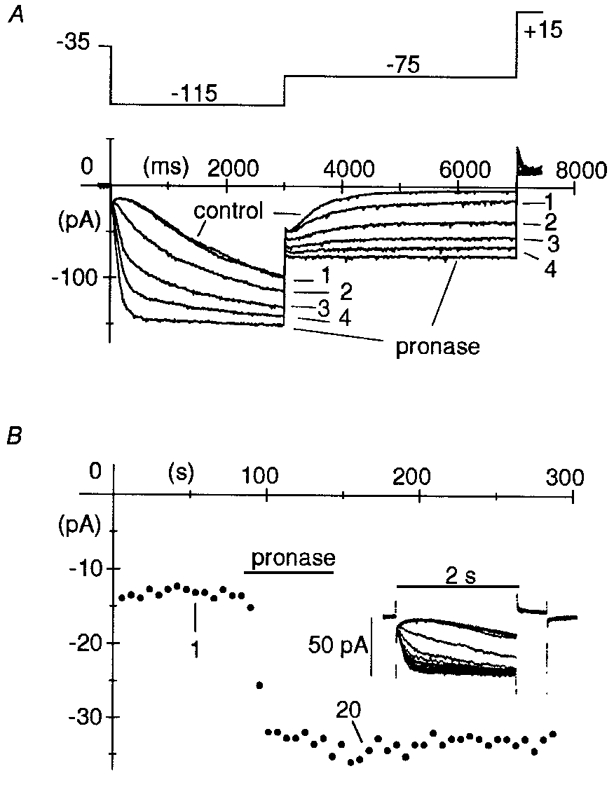
A, pronase (2 mg ml−1) was superfused on the intracellular patch side for 1 min, after which superfusion with normal intracellular-like solution was resumed, while activating/ deactivating If current traces were recorded during two-step protocols (see top panel illustrating the voltage protocol) to −115 mV (3 s) and −75 mV (4 s) applied every 10 s. Holding potential was −35 mV. A short 0.5 s step to +15 mV was applied after each pair of hyperpolarizations to fully deactivate If. Pronase induced progressive acceleration of activation at −115 mV, and slowing of deactivation at −75 mV, until after about 60 s, deactivation was fully blocked. Plotted are the first four records following switch-on of pronase superfusion and the records in control and at steady state after pronase, as indicated. B, time course of pronase action. Pronase was superfused for 1 min while applying 2 s steps to −95 mV to activate If (followed by 0.5 s steps to +15 mV to achieve full deactivation prior to subsequent activating step) every 6 s, from a holding potential of −25 mV. In the inset, 20 successive records are superimposed showing the progressive acceleration of current activation. The plot represents If amplitude at −95 mV. The amplitudes of 1st and 20th record of inset are indicated.