
Figure 3. Large depolarizing shift of f-channel open probability curve induced by pronase.
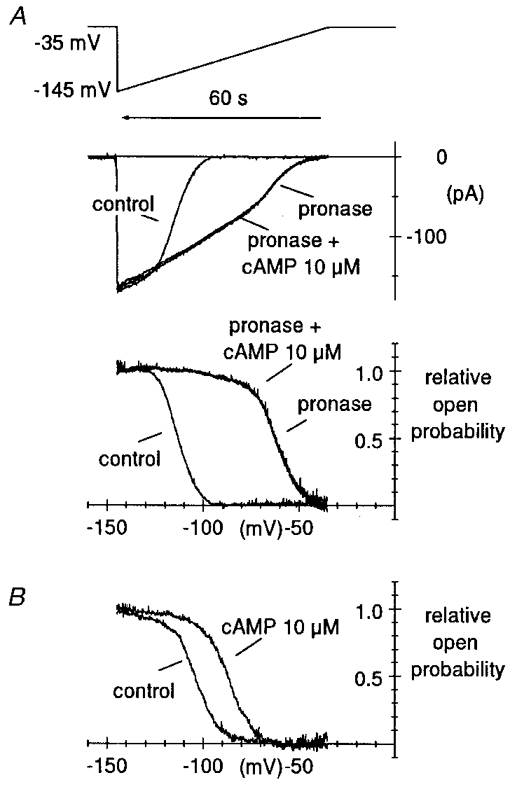
A, curves of the relative channel open probability (Po), normalized to maximum channel open probability, were measured by a voltage-ramp method previously developed (DiFrancesco & Mangoni, 1994) in control condition and after pronase treatment, as indicated. Ramps were applied from a holding potential of −35 mV to −145 mV and lasted 60 s (top panel). Notice that time runs backward for comparison with the open probability curves in the bottom panel. Ramp currents recorded in control conditions and after pronase, the latter with and without cAMP, are shown in the middle panel. Fitting open probability curves by the second power of the Boltzmann equation (see Methods) yielded V½ = −107.7 mV, v = 5.48 mV and V½ = −55.2 mV, v = 8.02 mV for the control and pronase curve, respectively (shift = 52.5 mV). The Po curve was not modified by 10 μM cAMP after pronase treatment. B, the same protocol was applied to determine, for comparison, the action of cAMP in a pronase-untreated macropatch. Best fitting parameters were V½ = −96.8 mV, v = 8.44 mV and V½ = −79.9 mV, v = 8.61 mV for the control and cAMP curve, respectively (shift = 16.9 mV).