
Figure 4. Lack of modification of the If conductance by pronase.
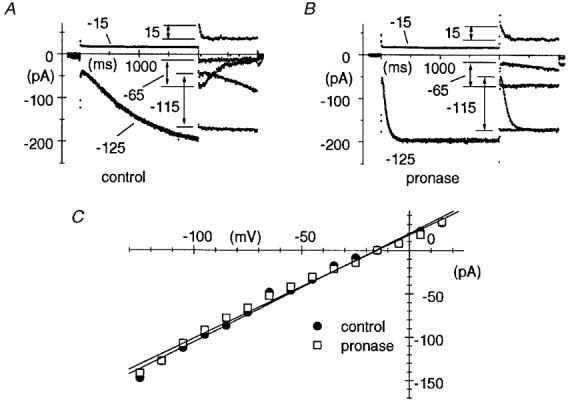
A and B, the fully activated I–V relationship of If was measured in control conditions (A) and after pronase treatment (B) according to a method previously developed (DiFrancesco et al. 1986), which consisted of two-step protocols where the current was either fully activated (by stepping to −125 mV for 2 s) or fully deactivated (by stepping to −15 mV for 2 s) before stepping to test potentials in the range −115 to +15 mV. In A and B, pairs of records shown correspond to test potentials of −115, −65 and +15 mV as indicated. Notice acceleration of current activation and slowing or block of current deactivation after pronase. C, fully activated I–V relationships in control conditions (•) and after pronase (□). The points were measured as differences between initial current values of pairs of traces corresponding to the same test potential (arrows in A and B). Linear regressions (straight lines) yielded reversal potentials of −15.7 and −15.1 mV, and conductances of 1.25 and 1.20 nS for control and pronase data, respectively.