
Figure 2. Simultaneous measurements of [Ca2+]c and ΔΨm reveal similar responses in terms of fura-2 ratio, but different responses in terms of ΔΨm when challenged with either KCl or glutamate.
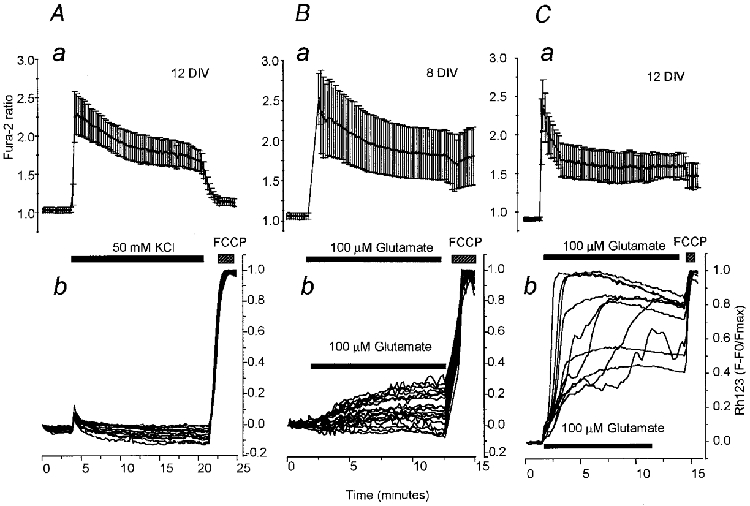
A, simultaneous measurements of fura-2 ratio (a) and normalised Rh123 fluorescence (b) in 14 neurons (12 days in culture, 12 DIV) during prolonged application of 50 mM KCl. The buffer was made by isotonic replacement of NaCl and the addition of the glutamate antagonists MK-801 (20 μM), CNQX (20 μM) and MCPG (1 mM) to prevent the effects of endogenous glutamate. In all these experiments the mitochondrial uncoupler FCCP (1 μM) was applied at the end of the experiment in order to dissipate ΔΨm completely as indicated ( ) and the mean ±s.d. of the fura-2 responses are shown. B, simultaneous measurements of changes in fura-2 ratio (a) and Rh123 fluorescence (b) in 18 neurons at 8 DIV during prolonged exposure to 100 μM glutamate (with 10 μM glycine to facilitate NMDA receptor activation). C, simultaneous measurements of changes in fura-2 ratio (a) and Rh123 fluorescence (b) in 11 neurons at 12 DIVduring prolonged exposure to glutamate as in B. Note the variability in the amplitude and time course of the loss of ΔΨm in individual neurons during glutamate exposure.