
Figure 3. Variability in the amplitude and time course of the mitochondrial response to glutamate exposure in hippocampal neurons.
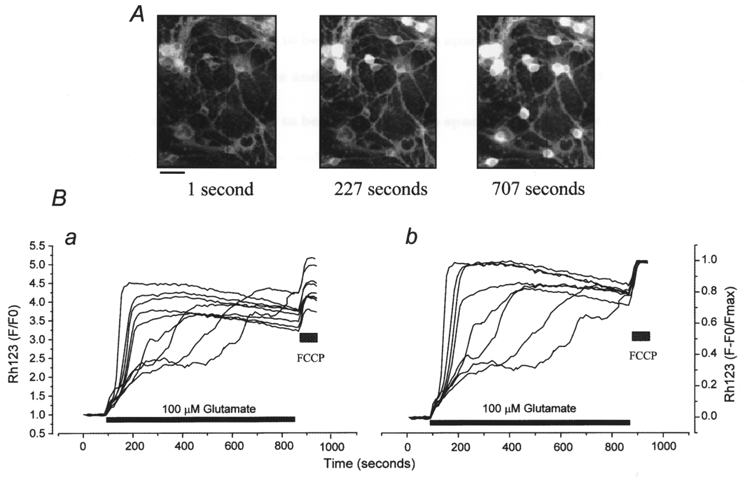
A, images showing changes in Rh123 fluorescence during prolonged exposure to 100 μM glutamate. Scale bar, 20 μm. B, changes in Rh123 signal with time from the data shown above, to show the variability in the time course and amplitude of the mitochondrial response to glutamate in this field of neurons. The signals are shown normalised to the baseline only (a) and to both baseline and the response to 1 μM FCCP (b; F − F0/Fmax), which was applied at the end of the experiment ( ).
).