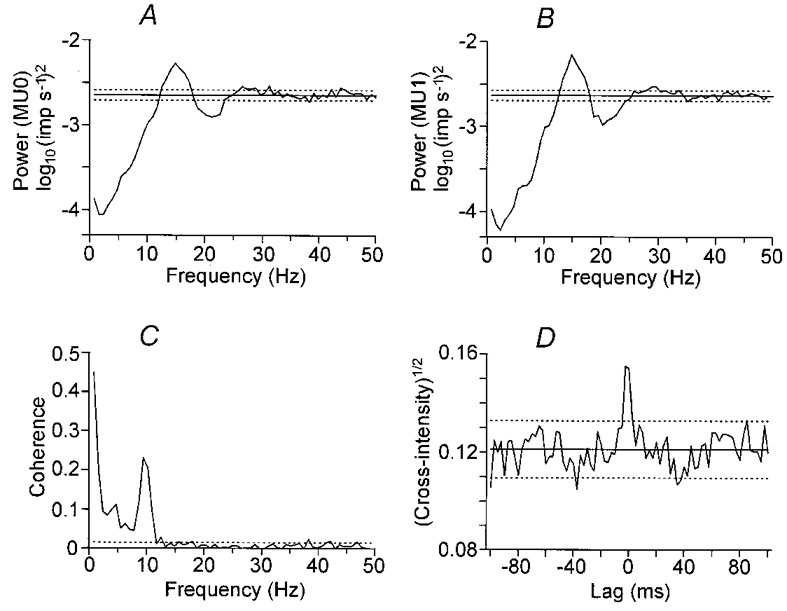
Figure 2. Frequency- and time-domain analyses on the spike trains of a motor unit pair during the extension phase of movement.

Statistical analysis of coupling between motor unit activity for a database of 112 movements performed as in Fig. 1. A and B show logarithmic auto-spectral density function estimates for each motor unit. Peaks around 15 Hz correspond to the average firing rate of the two units. C shows the estimated coherence between the motor units, revealing a strong coupling of activity at 10 Hz, as well as coupling around 4 Hz. D shows the square root of the cross-intensity function, with an 10 ms wide peak around lag time zero. Horizontal dotted lines indicate the approximate 95 % confidence limits.
