
Figure 3. AP increases intracellular Ca2+ in M-1 cells.
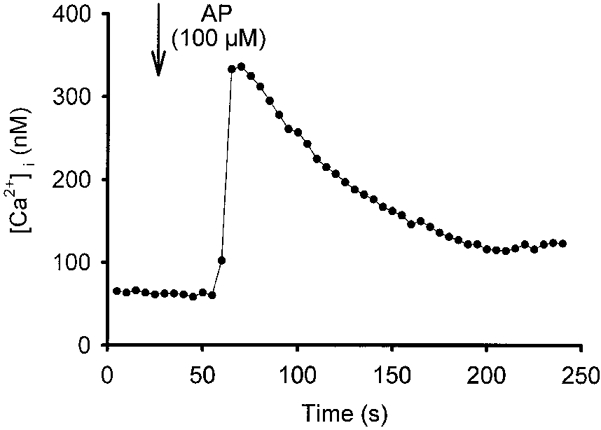
Using fura-2, [Ca2+]i was monitored in a single M-1 cell. AP was added to the bath at the time indicated by the arrow to give a final concentration of 100 μM, and subsequently remained in the bath.