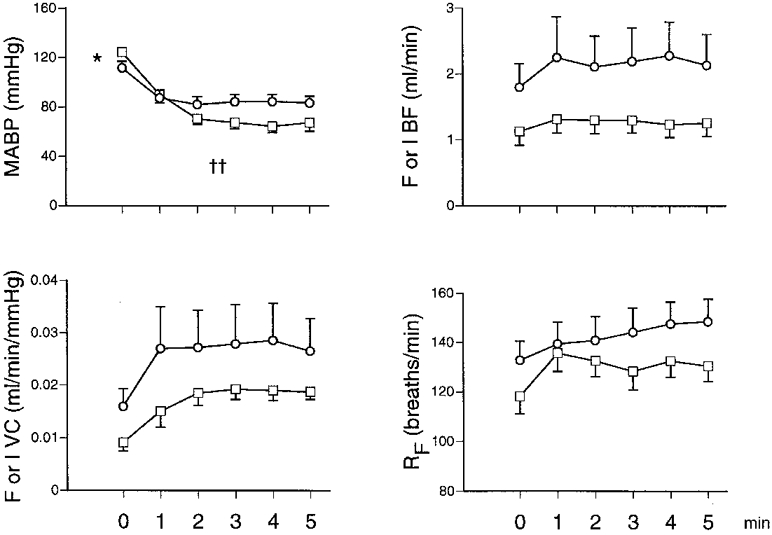
Figure 1. Responses evoked by breathing 8% O2 in 7N and 7CH rats.

MABP, mean arterial blood pressure; F or I BF, femoral or iliac blood flow (ml min−1); F or I VC, femoral or iliac vascular conductance (ml min−1 mmHg−1); RF, respiratory frequency. □ and ○ indicate 7N and 7CH rats, respectively; each value is shown as the mean ±s.e.m. Horizontal axes show time before and during a 5 min period of 8% O2. †† Significant difference between 7N and 7CH rats for change evoked from baseline (P < 0·01). * Significant difference between baseline values of 7N and 7CH rats (P < 0·05). Note that 7N rats were switched from air to 8% O2 for 5 min, while 7CH rats were switched from 12 to 8% O2 for 5 min.
