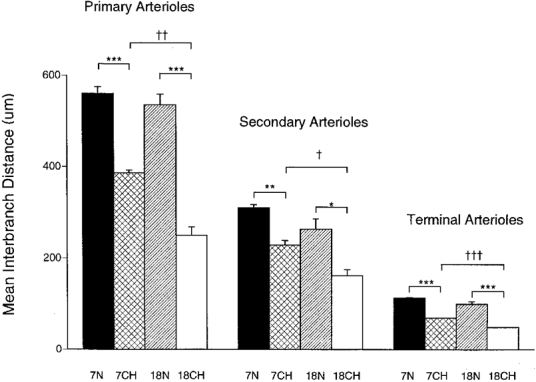
Figure 4. Mean interbranch interval along primary, secondary and terminal arterioles in 7N, 18N, 7CH and 18CH rats.

Each column shows the mean ±s.e.m. of interbranch interval along arteriole, the category of arteriole being indicated above the columns, the group of rats being indicated below individual columns and by shading as in Fig. 3. ***P < 0·001, **P < 0·01, *P < 0·05, significant difference between 7N and 7CH or 18N and 18CH rats. †††P < 0·001, ††P < 0·01, †P < 0·05, significant difference between 7CH and 18CH rats. n = 6 for each group, each value having been generated from the means of 10–20 measurements made in each of the right and left muscles of each animal.
