
Figure 3. DSI is linearly related to voltage-step duration and total Ca2+ influx.
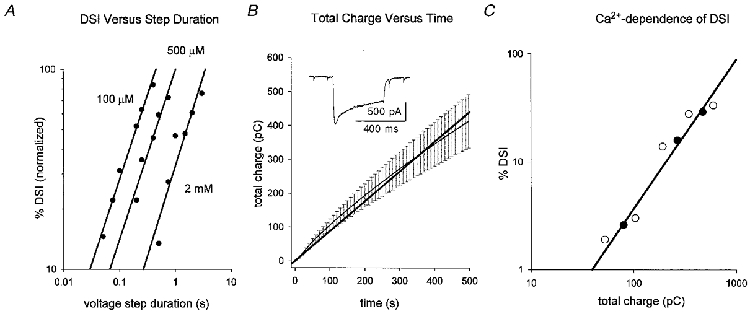
A, normalized DSI (maximal DSI = 100%) is plotted versus voltage-step duration on a double logarithmic axis. The graph represents the grouped data from cells with the indicated [BAPTA]i (n = 4, 6 and 5 for 100 μM, 500 μM and 2 mM BAPTA, respectively), so each data point represents the mean DSI from several cells for a given postsynaptic depolarization. Only those voltage steps that elicited submaximal DSI were plotted; error bars omitted for clarity. The slopes in all cases were near 1·0 (see text). B, a plot of total charge versus duration of postsynaptic depolarization. Cd2+-subtracted Ca2+ currents elicited by voltage steps to 0 mV were integrated over time for 5 cells with 500 μM BAPTA. The mean total Ca2+ influx (±s.e.m.) was plotted (at 10 ms intervals) versus voltage-step duration, which gave a nearly linear relation over the 500 ms period. The mean data from 5 cells are plotted as the thin black line. A linear regression line through the means is displayed as the thick black line. The graph shows that to a first approximation Ca2+ influx calculated as the current integral is reasonably well fitted by a linear function. The inset shows a sample Ca2+ current from one of the cells used. Scale bar 500 pA, 400 ms. C, data from one cell with 100 μM [BAPTA]i where DSI is plotted versus total Ca2+ influx. Calcium influx was varied first by changing the duration of the postsynaptic depolarization in control solution, i.e. 2·5 mM [Ca2+]o (•) and then again after increasing [Ca2+]o to 5 mM (○). Total Ca2+ influx was obtained by integrating the Cd2+-subtracted currents for each step. The results are typical of 3 experiments like this. The mean slope of the relation between DSI and Ca2+ influx was 1·3 (n = 3).