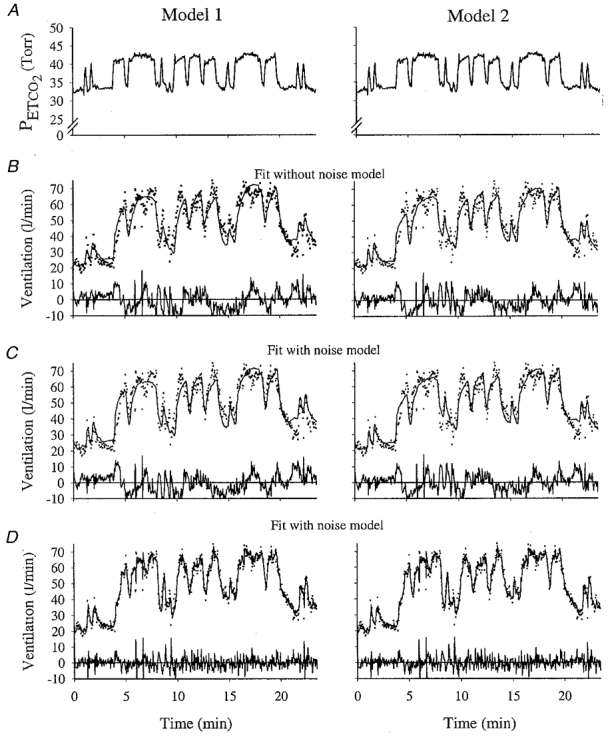
Figure 3.

Example of model fits to hypoxic data for Model 1 and Model 2 for one subject
A, end-tidal PCO2. B, the fitted output from the model that does not contain a noise model. C, fitted output from the model containing a noise model; line shows deterministic component only of the output. D, the fitted output from the model containing a noise model; line shows total output (deterministic + noise). For ventilation, dots indicate data, and lines indicate fitted model output. The residuals are shown below each fit. Same subject as in Fig. 1
