
Figure 8. Summary of the average cross-correlograms obtained in each condition.
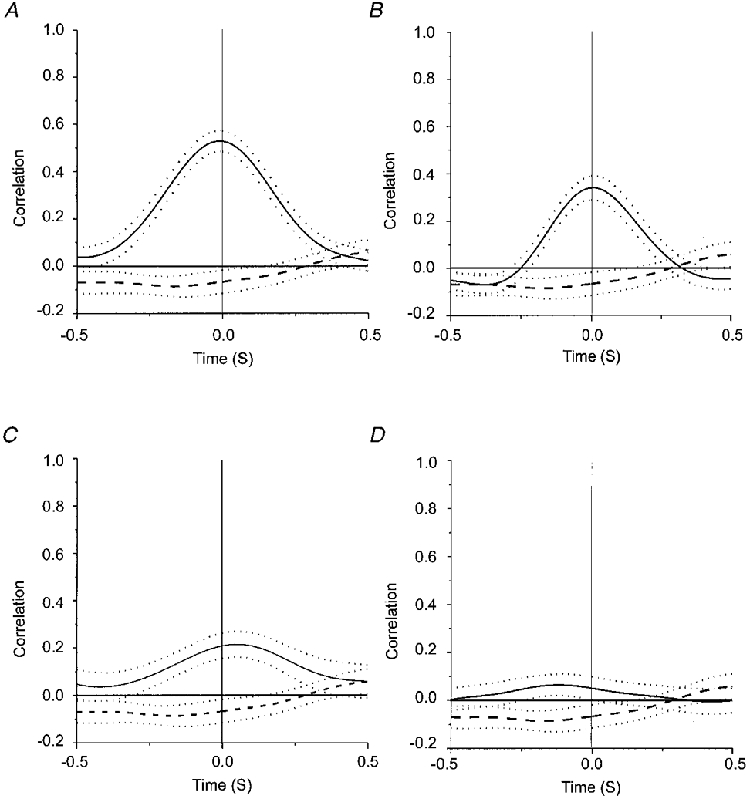
Cross-correlograms averaged from all records for IPSIPSP (A), BIPSP (B), IPSIFDI (C) and BIFDI (D). Dotted lines indicate the standard error of the mean. A dashed line indicates the average cross-correlogram calculated between 50 unrelated data pairs.