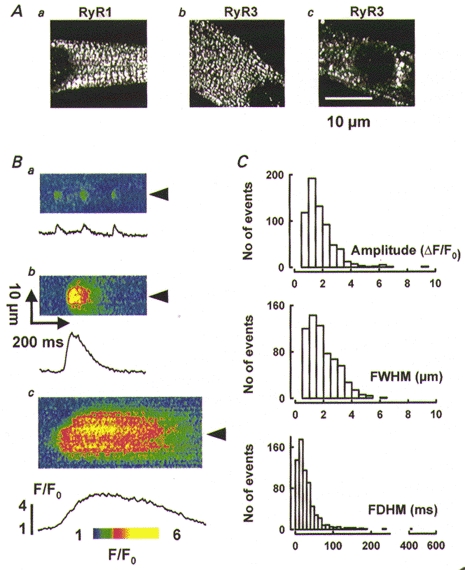
Figure 1. Discrete events of Ca2+ release in wild-type myotubes.

A, immunolocalization of RyR1 (a) and RyR3 (b and c) in wild-type cells. B, line-scan images of normalized fluorescence with discrete events of Ca2+ release, illustrating a variety of amplitudes (from as little as 0.95 in a to 3.3 in b), spatial widths (from 0.71 to 6.3 μm) and durations (from 12 to 510 ms). C, histograms of amplitude, spatial width and duration, for 660 events detected in 57 cells as described in Methods.
