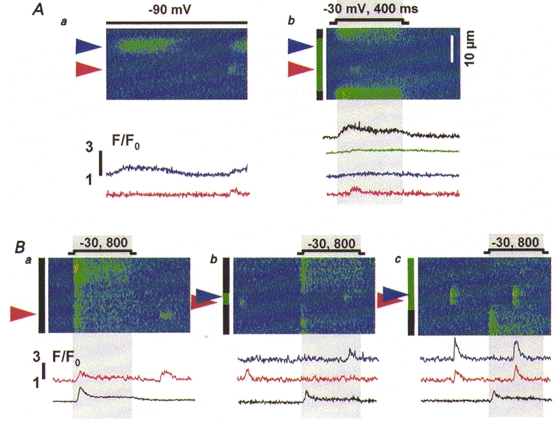
Figure 6. Spatial segregation of two forms of Ca2+ release in wild-type cells.

A, line-scan images of F/F0 from the same myotube held at -90 mV (a) or depolarized as indicated (b). Arrowheads indicate locations where discrete events arose. The green bar in b marks the portion of the scanned region where voltage did not elicit Ca2+ release and black bars the portions where it did. Traces represent normalized fluorescence averaged within the regions indicated by bars or in 2.5 μm-wide bands centred at the arrowheads, and are colour coded accordingly. B, images of normalized fluorescence obtained from another cell depolarized to -30 mV for 800 ms as indicated. Note the different time scales in A and B, corresponding to different scanning rates (2 vs. 4.3 ms per scan).
