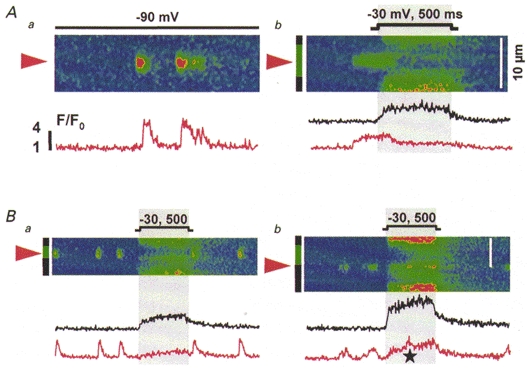
Figure 7. Spatial segregation of two forms of Ca2+ release in RyR3-knockout myotubes.

A, line-scan images from the same knockout myotube held at -90 mV (a) or depolarized as indicated (b). B, images from another cell, depolarized as indicated (mV, ms). The colour code marking regions and averaged fluorescence traces is the same as in Fig. 6. The star in Bb marks an infrequent discrete event that occurs superimposed with voltage-operated release.
