
Figure 6. Ensemble average of single channel currents has a time course similar to the macroscopic current.
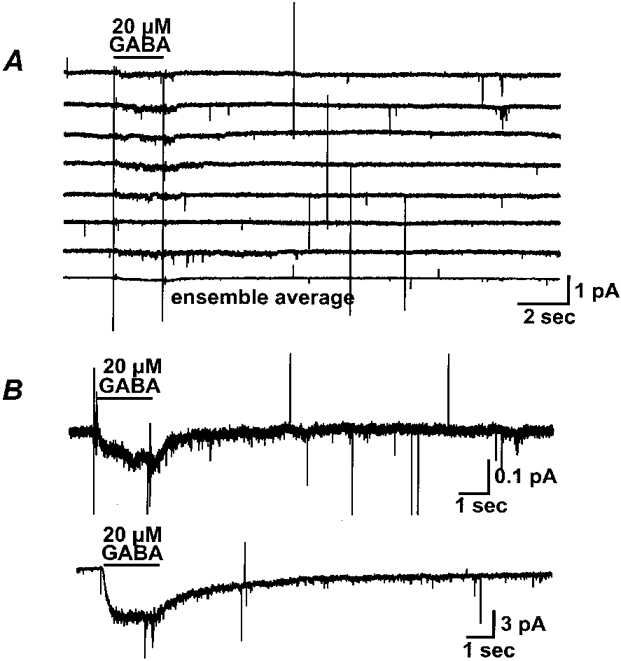
A, representative current traces of 20 μm GABA-activated single channel activity from a single patch are shown; the bottom trace is the average of 12. The membrane voltage of the patch was clamped to -200 mV. GABA (20 μm) was applied through a computer-controlled piezo fast-switching system for 2 s. B, comparison of the ensemble average with the GABA response in a macropatch. The upper trace is the same ensemble average from A, on a different scale. The lower trace is the GABA-induced current in a macropatch from an oocyte expressing ρ1 GABA receptors.